SAP/BusinessObjects

sap lumira (codename "Hilo")

When you’re a ship the size of SAP, things just take longer. What made this project especially difficult was the need to coordinate across multiple geo-located teams across the company, cultural issues galore, and a primary development team that felt isolated and unmotivated to take on the challenge of evolving BusinessObjects into the next generation of SAP Analytics products. After a great deal of discussion, we decided that the product would be focused on business users, empowering them to discover sources of data and the insights contained within. This is the short version of the story of how Lumira came to be.

overview

my role

As the Chief Experience Officer for SAP Business Objects, I led the inception of and production design for what became Lumira. Modernizing the UX discipline at SAP Analytics was a large part of my role.

THE TEAM

Spread across 7 international sites, my team consisted of 8 UX & UI designers, 1 principal Visualization designer, 2 UXR, 4 PMs, lots of engineers, a lot of very senior stakeholders.

mission

I was there to force change in how UX design was done at SAP. The leadership of the Analytics business unit needed to deliver a modern, next-generation product, which they felt was essentially impossible given the lack of cloud design DNA in the existing design team. I needed to draw on 10+ years of enterprise SaaS product design experience to teach and implement a practice that would take SAP Analytics into the cloud era.

why me?

As a native French speaker, I was hired to re-engage the French design and development teams just after the Business Objects acquisition. SAP needed this team to lead the development of a next-generation BI tool that would replace Business Objects Webi.

The goal was to design and deliver a modern BI product that enabled self-service analytics for business users. SAP needed to unlock that experienced Paris BI DNA to build such a product. As a Canadian, I was deemed “neutral” and culturally “close enough” to join the French team and embed without a problem.

I spent 50% of my time in Paris, 25% of my time in TelAviv, Waldorf, Shanghai and Vancouver and 25% of my time in Palo Alto.

creative unblocking

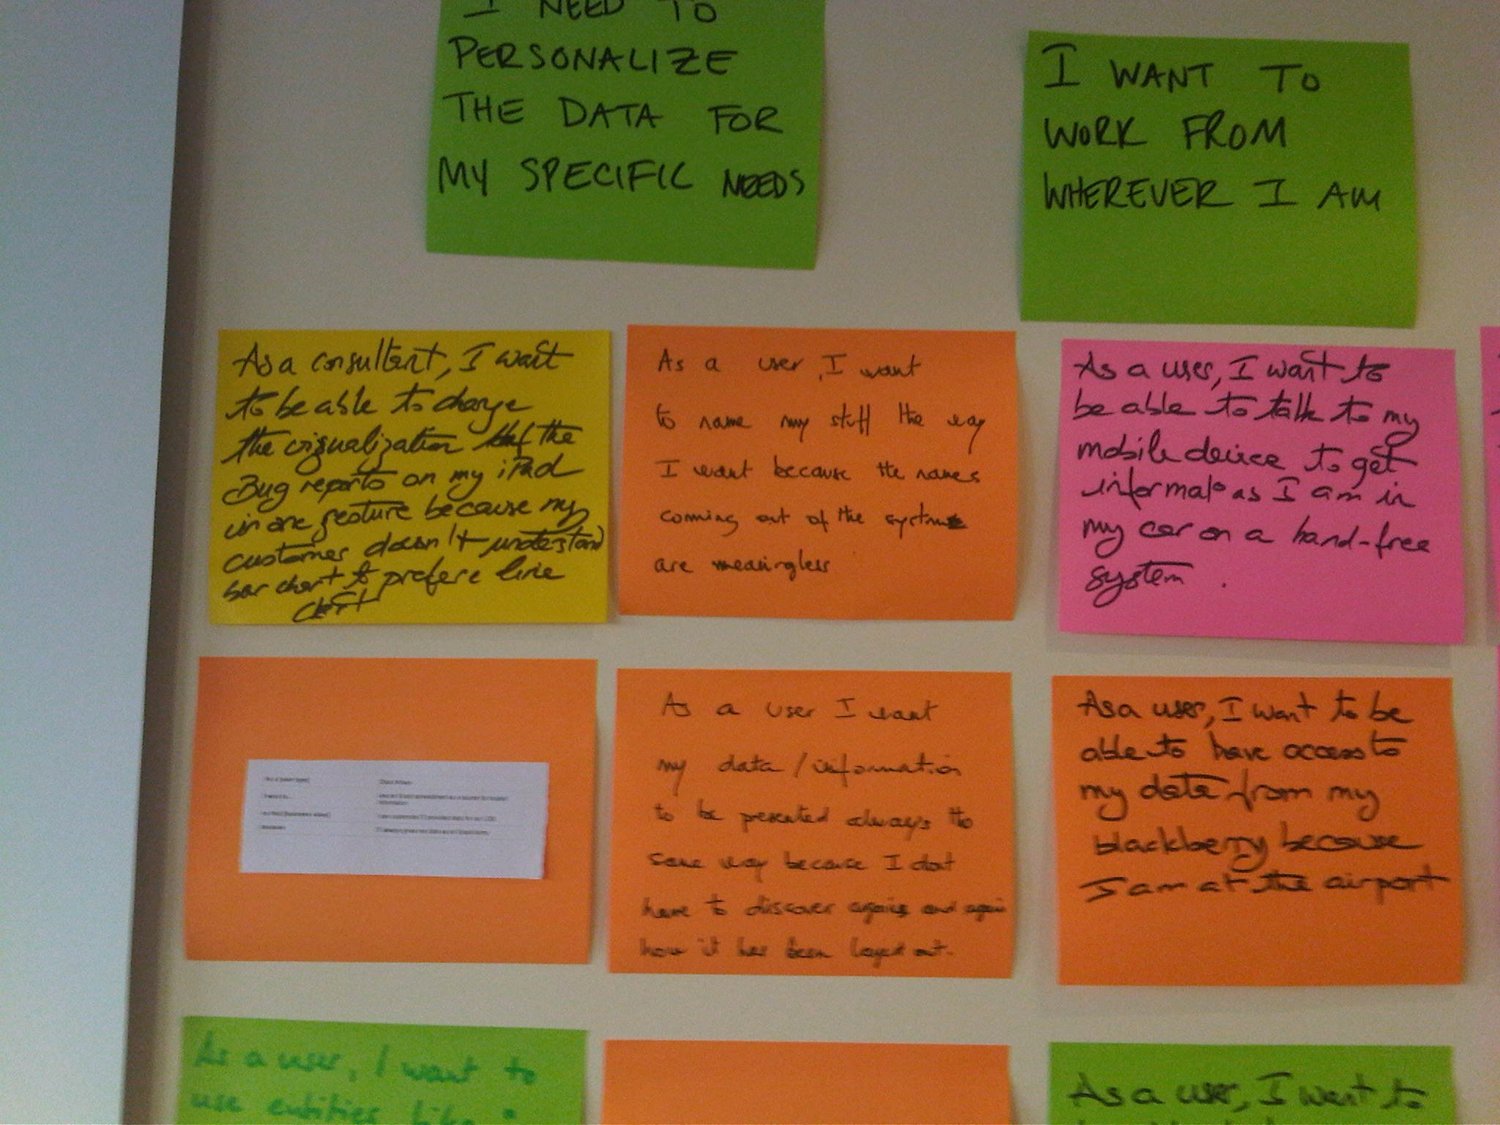
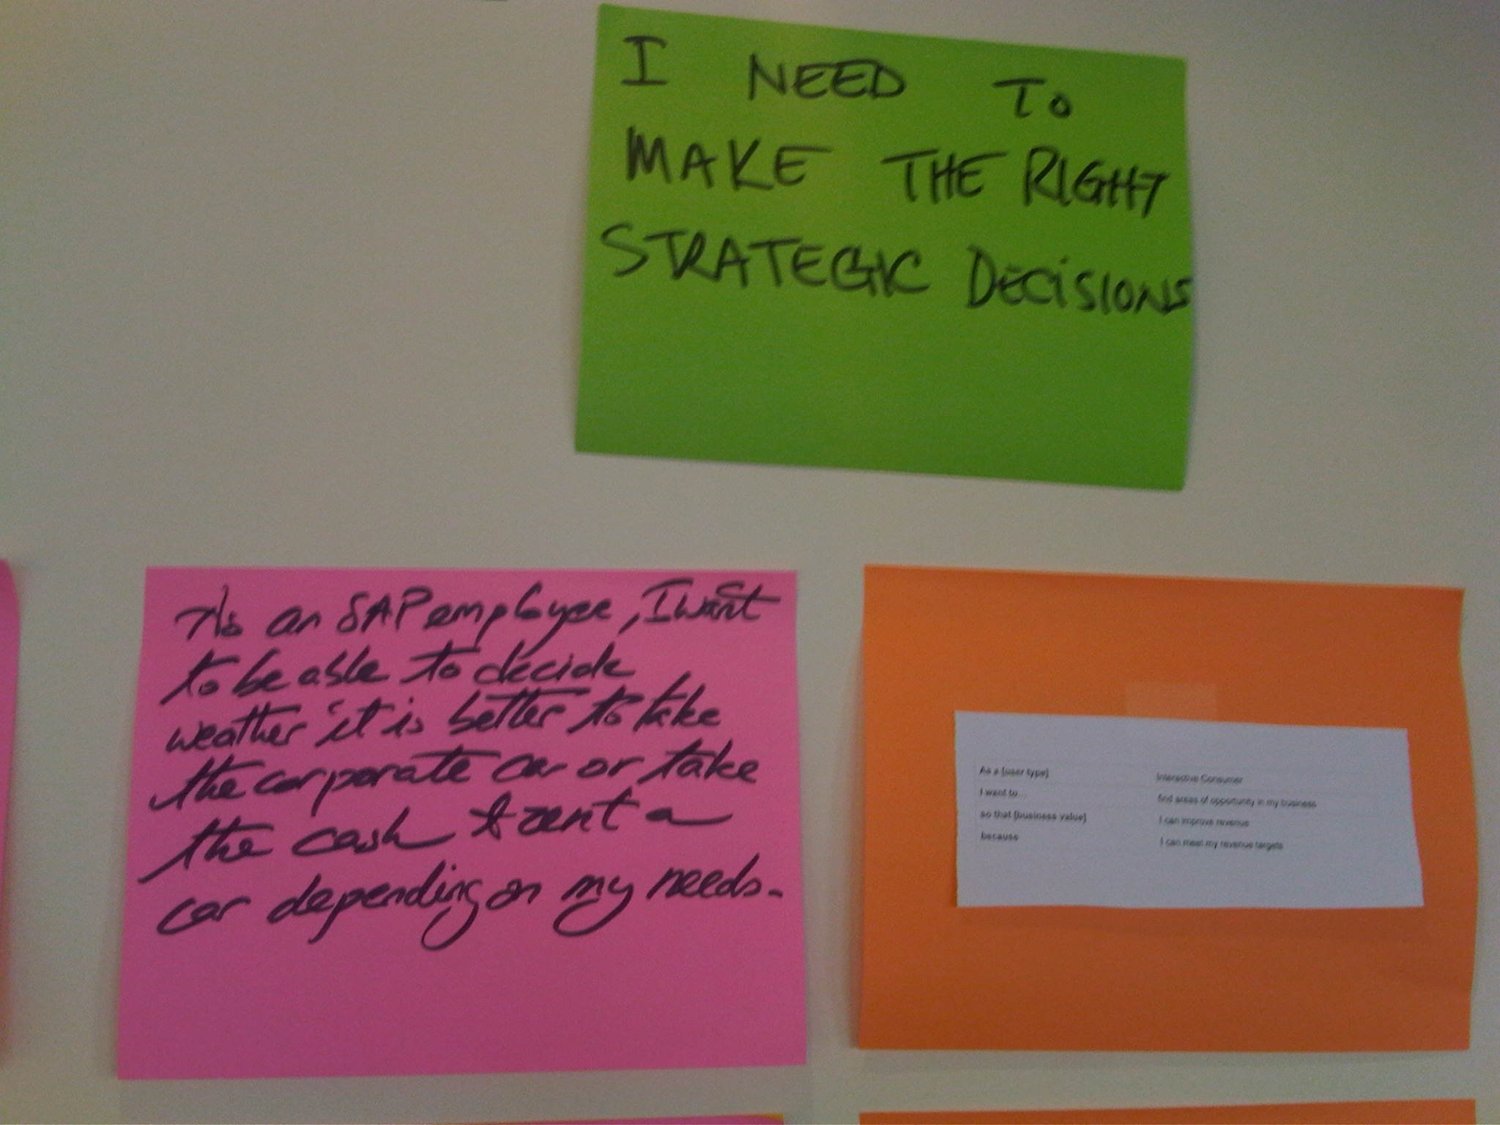
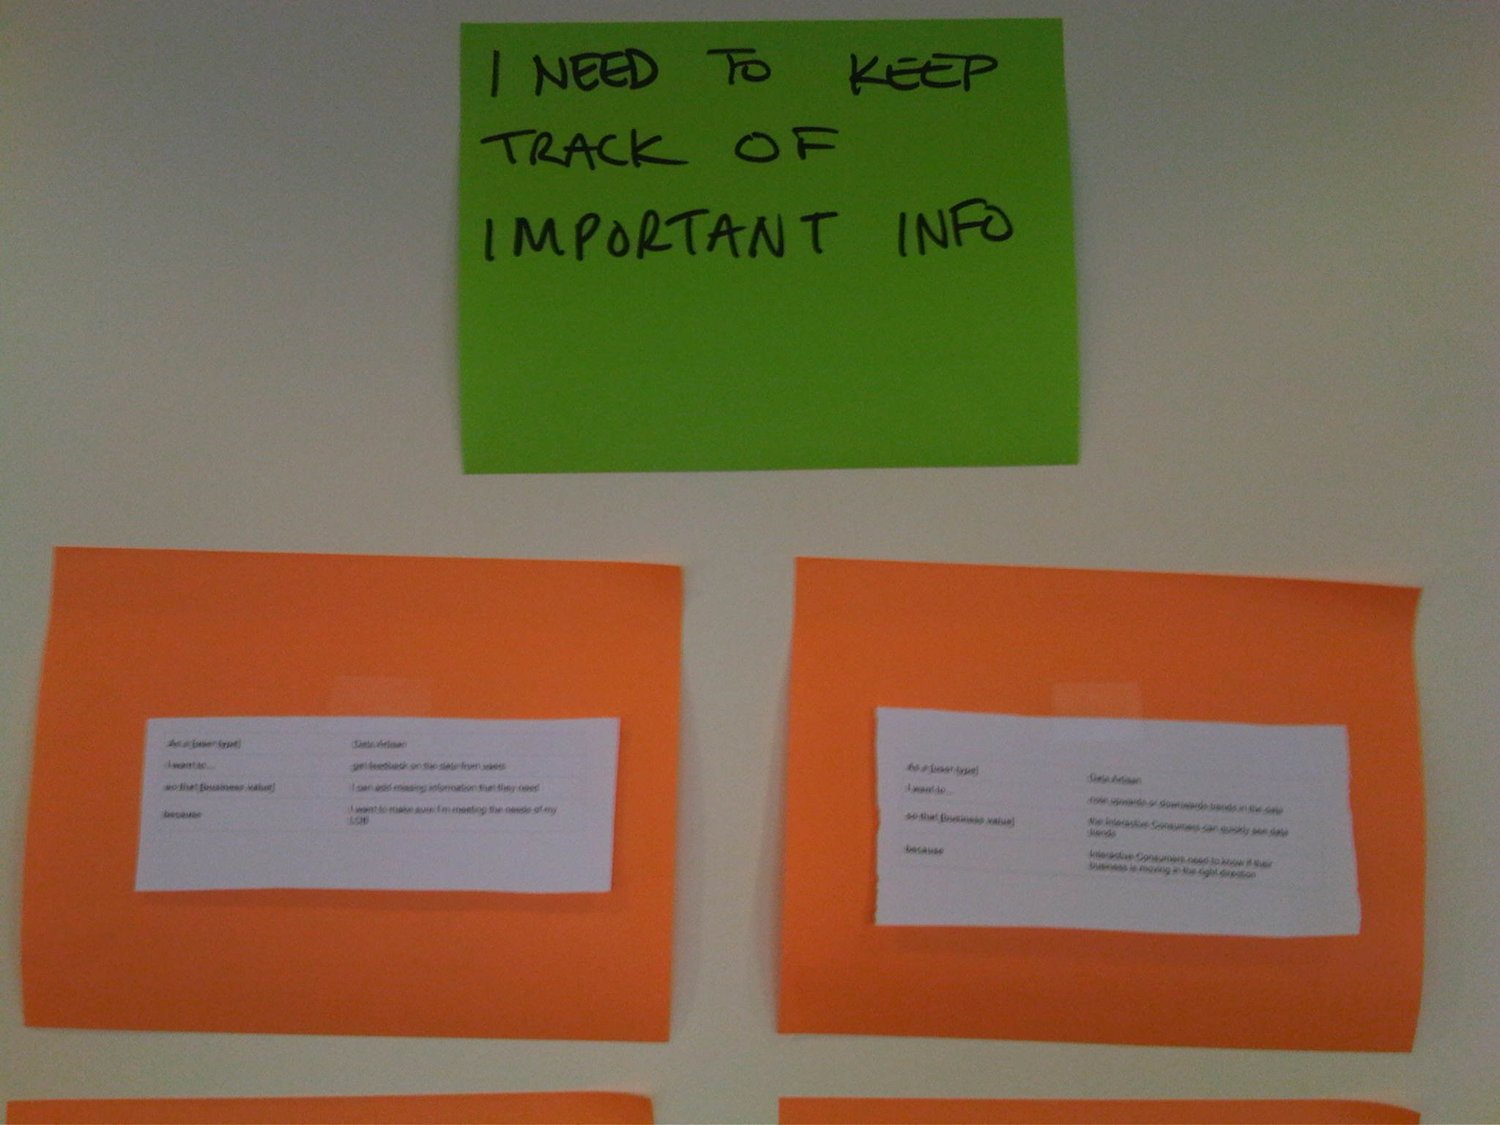
I planned a 3-month workshop Paris where team members from Waldorf, Vancouver, Shanghai, Palo Alto and TelAviv assembled to get to know each other and creatively talk about the future of BI. We unshackled people from the boundaries of software and got them imagining a world where business intelligence gave people exactly what they wanted.

  • We commandeered the executive boardroom for 3 months!

    All the ideas, use cases, goals, outcomes that the group came up with. Organized by theme and in some cases, feature.

  • Personalize my data experience. Make it work for ME.

    This was another very common theme throughout the workshop.

  • Data drives strategy

    For people doing analysis of any kind, much of the time insights are being sought so that they may be the backbone of a strategic initiative.

  • Tracking metrics and KPIs is a super important aspect of BI and Analytics.

  • "What if" is one of the most common questions to ask of data

    Would you like to know the future? It seems odd to write down, but when you think about it, this is what scenario modelling is. We played with this idea in the Theme Park prototype.

  • Dirty data vexes people trying to do analysis.

    The worst is knowing something isn't correct and being unable to do anything about it.

  • People bring their whole selves to work

    We saw a large number of desired outcomes that were not work product; rather they were how people wanted to feel or deliver an intangible.

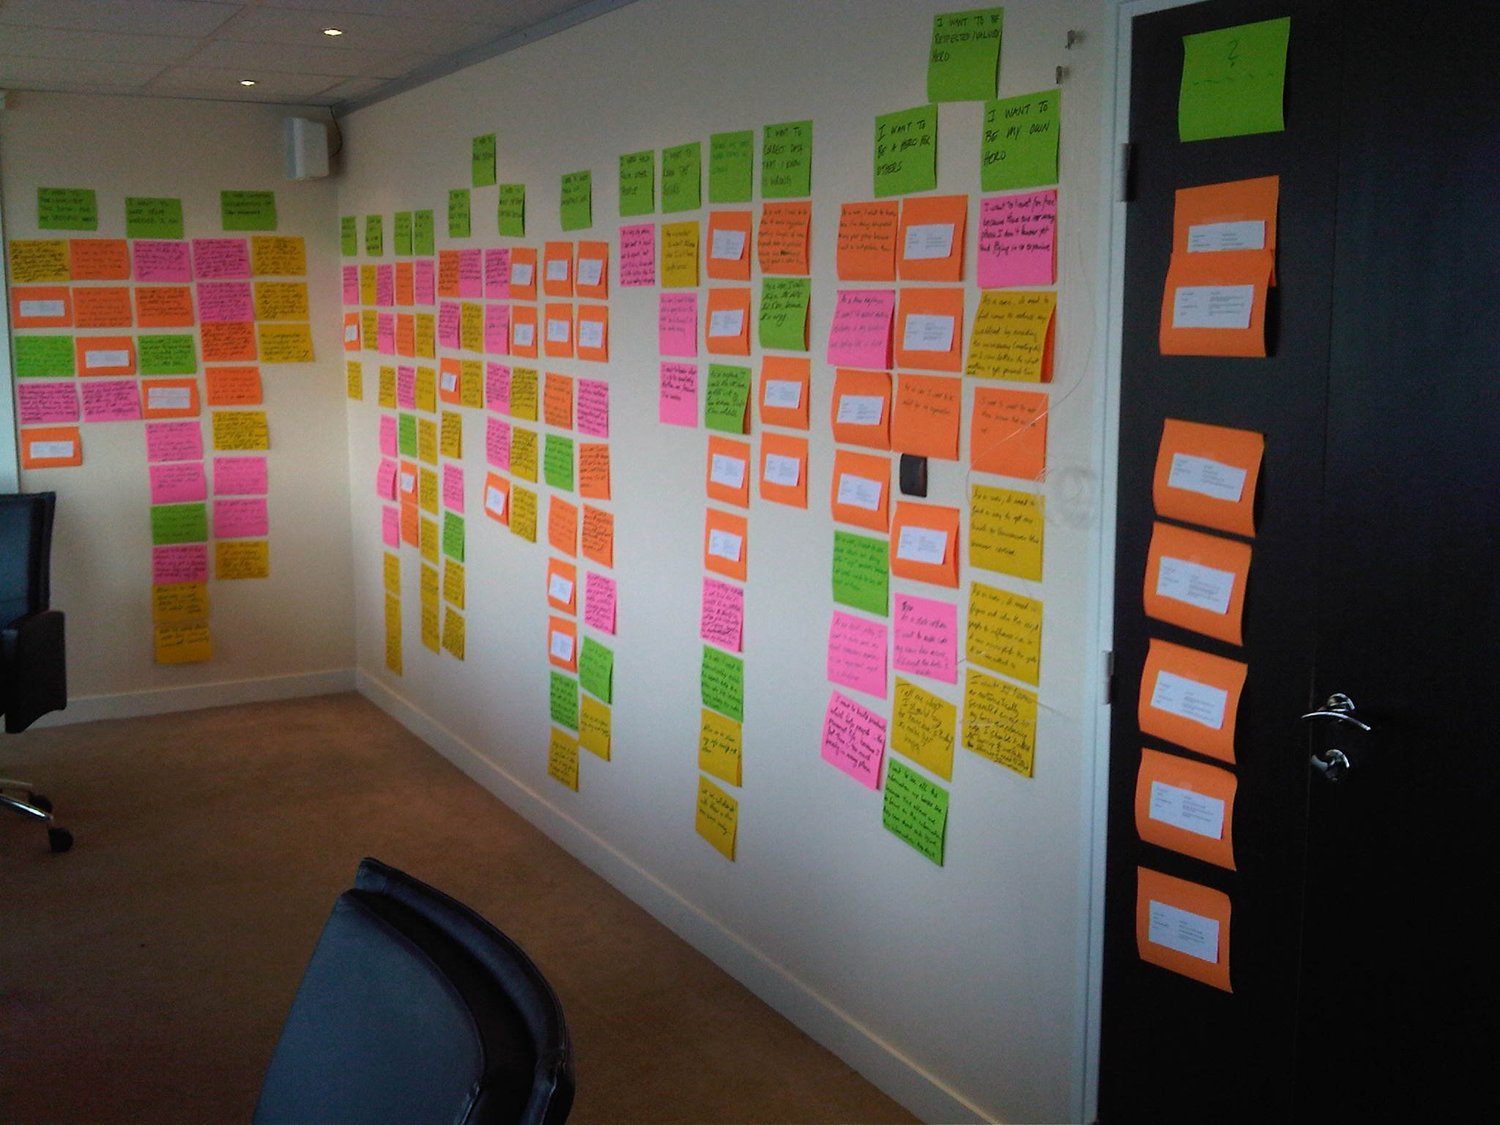
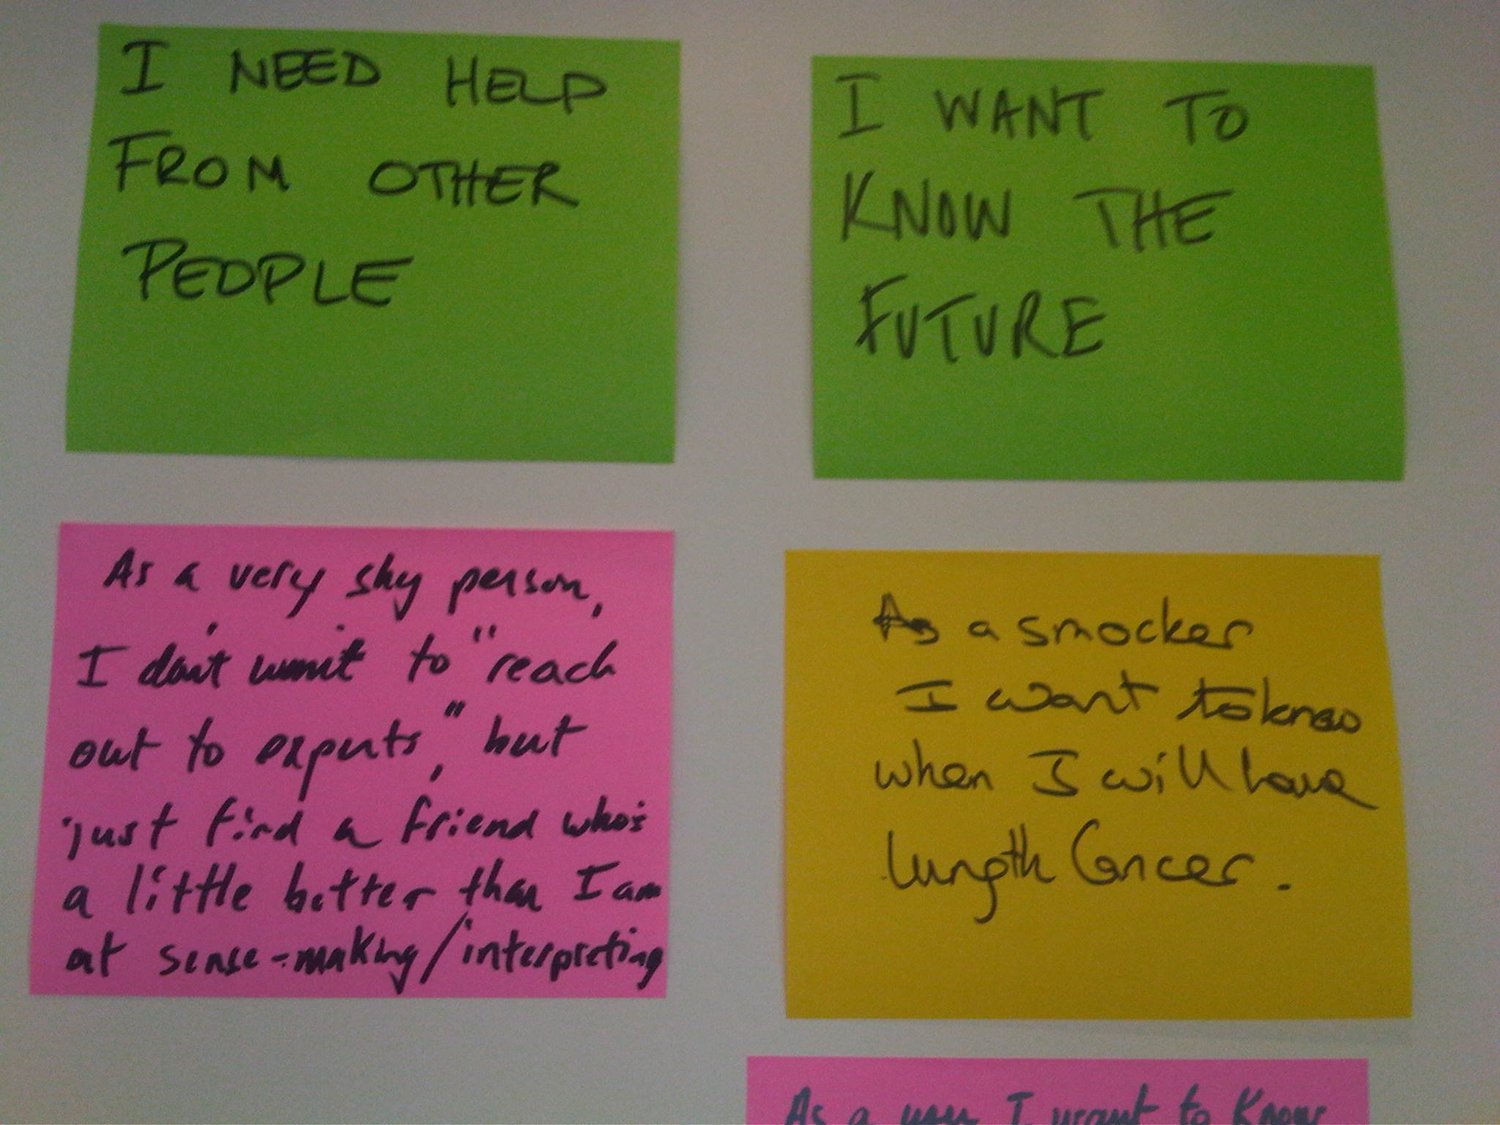
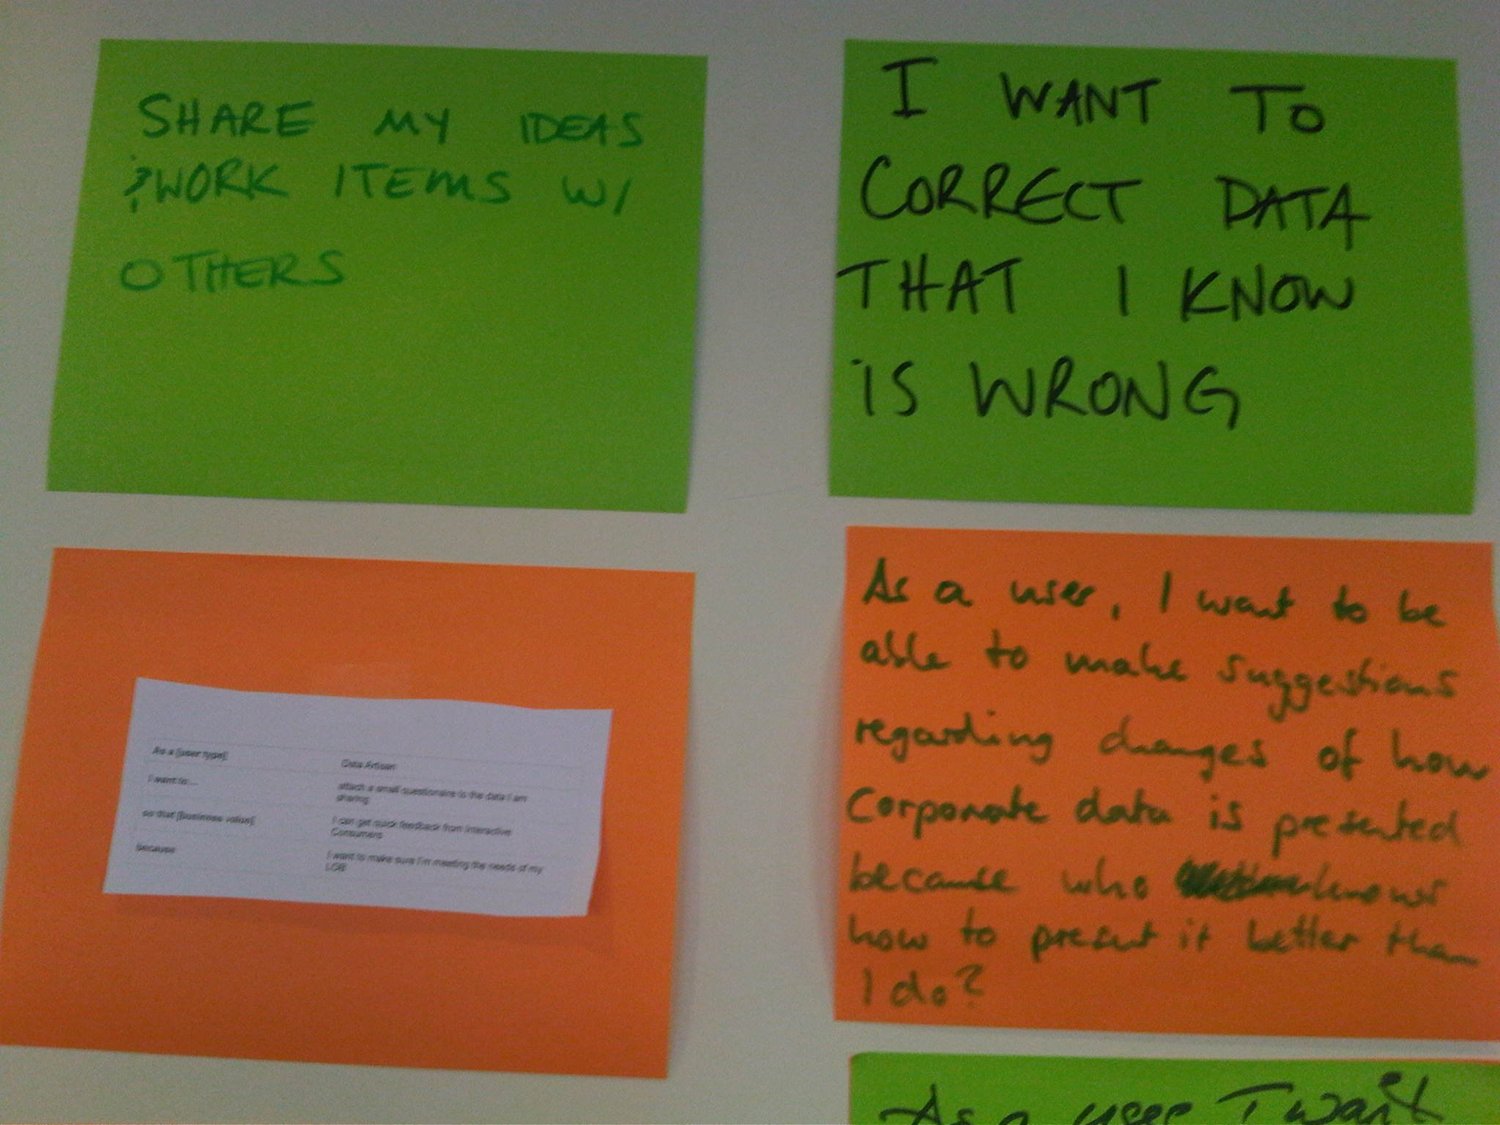
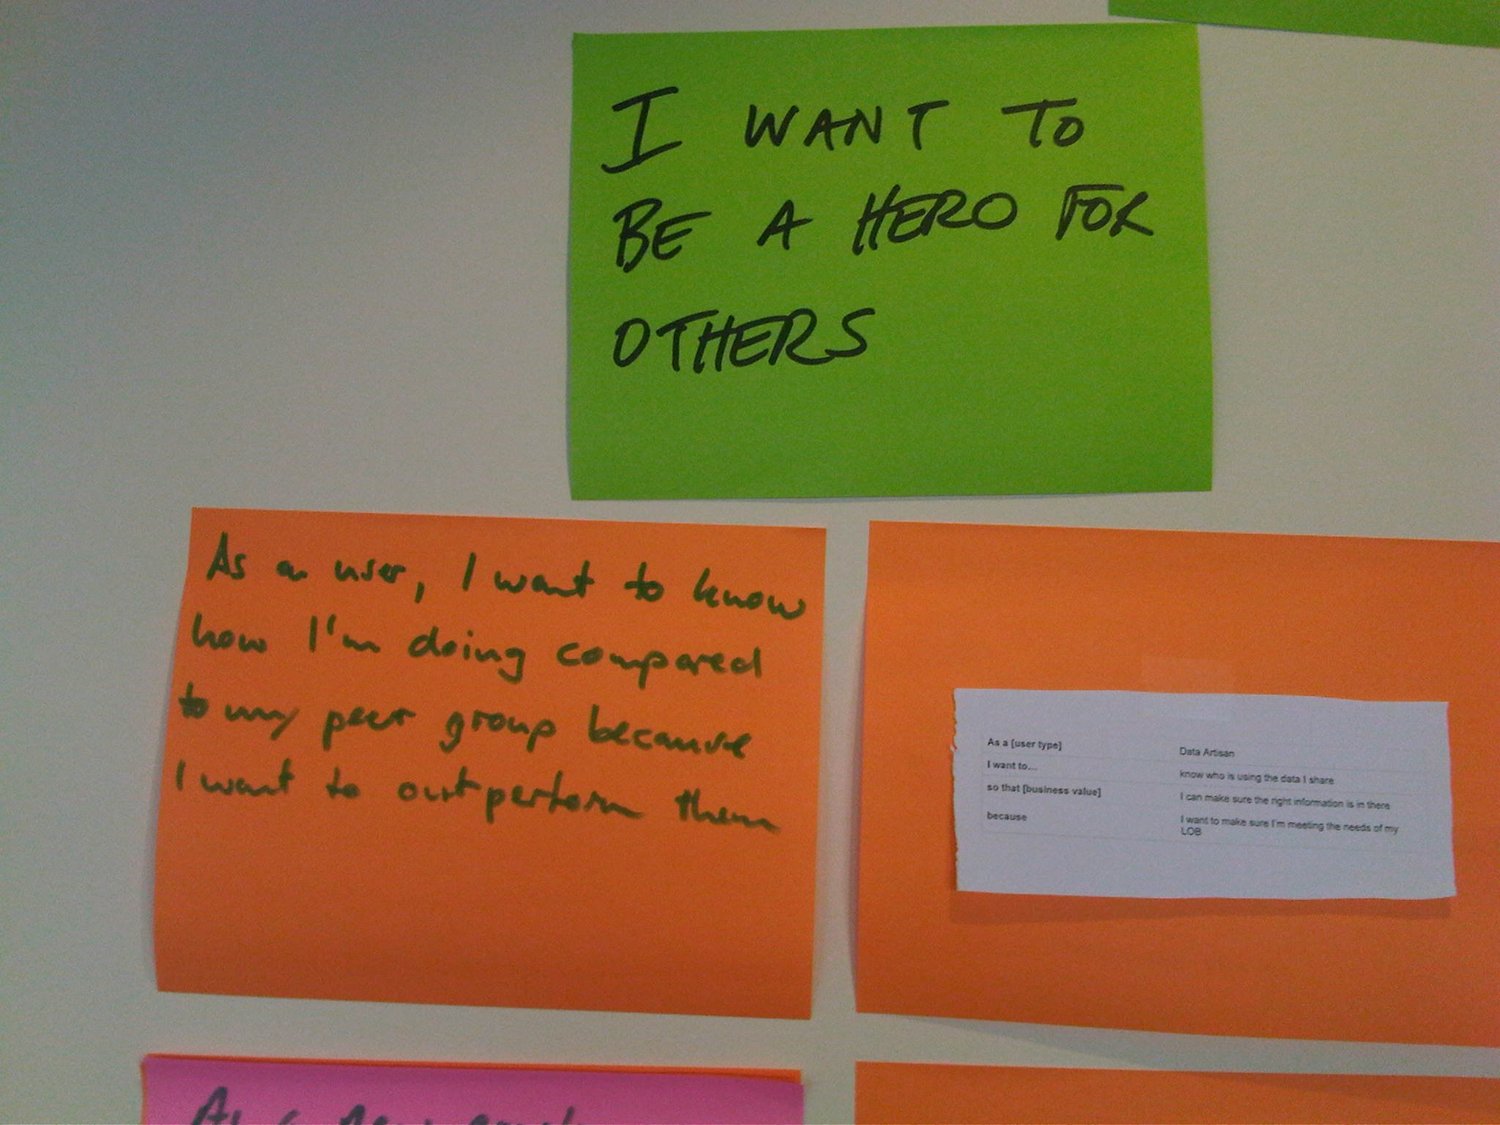
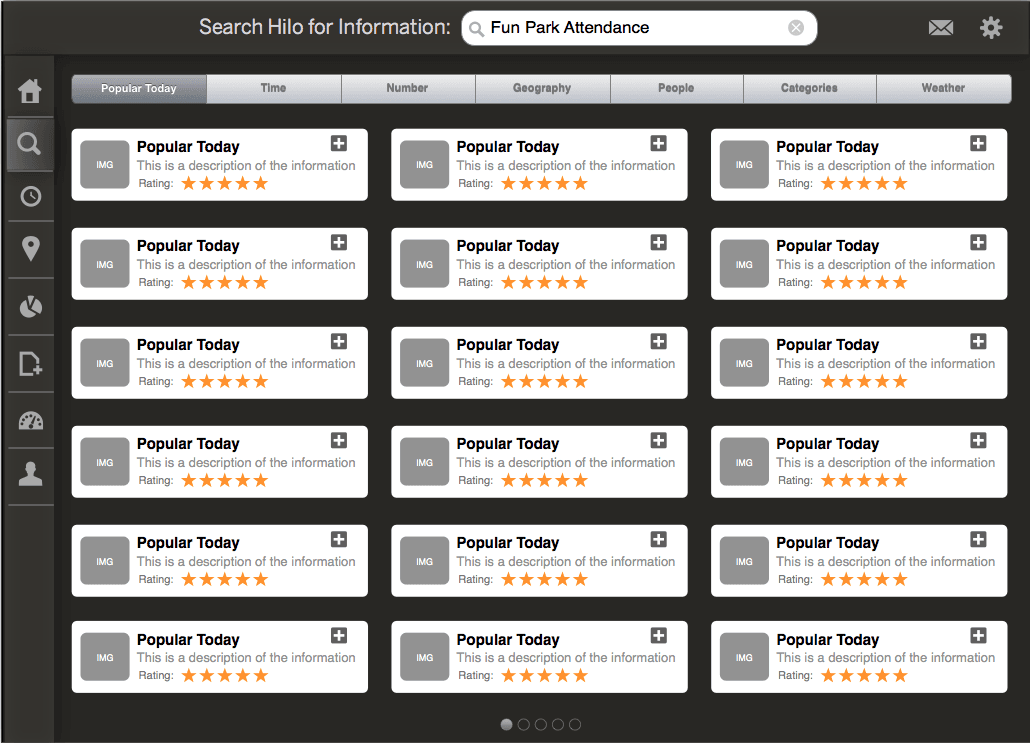
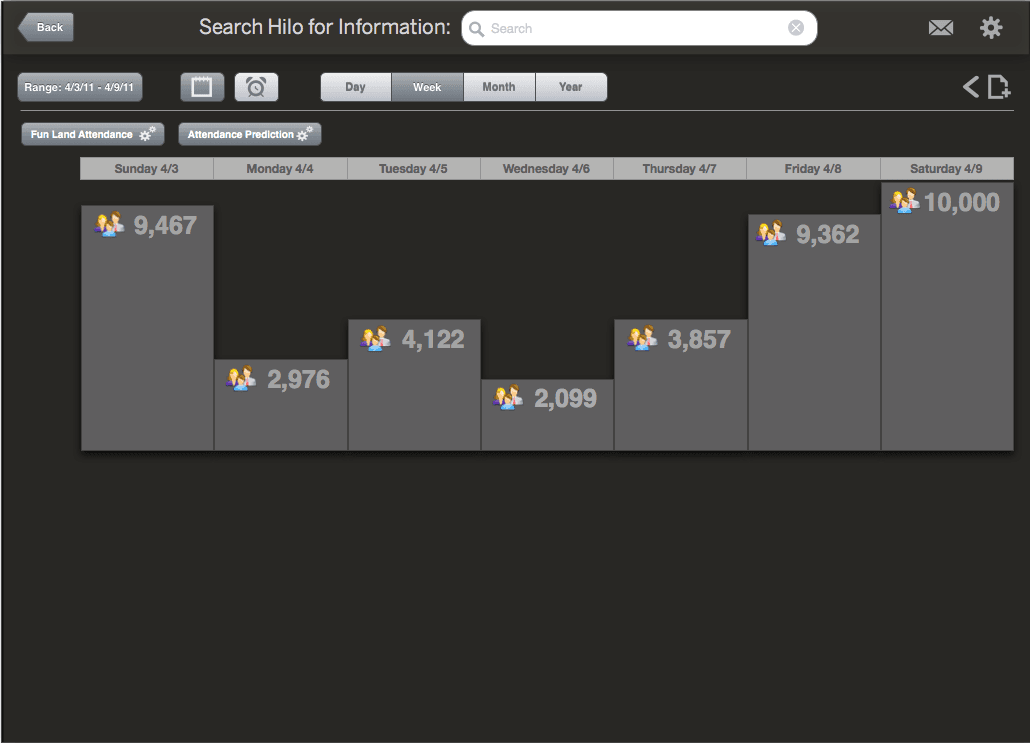
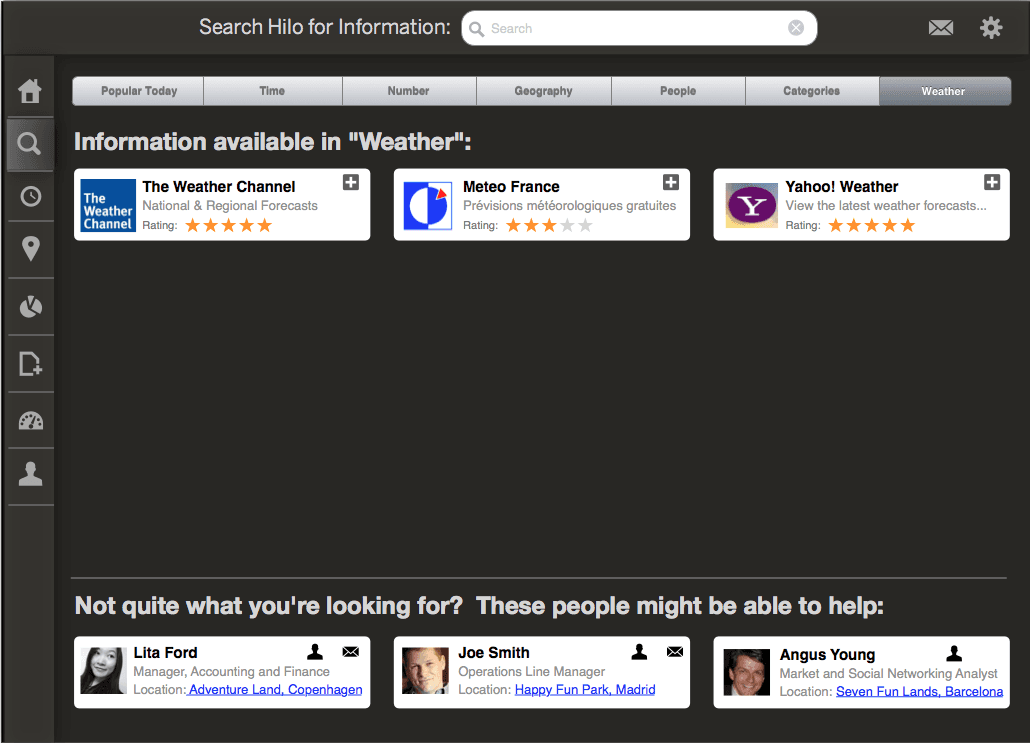
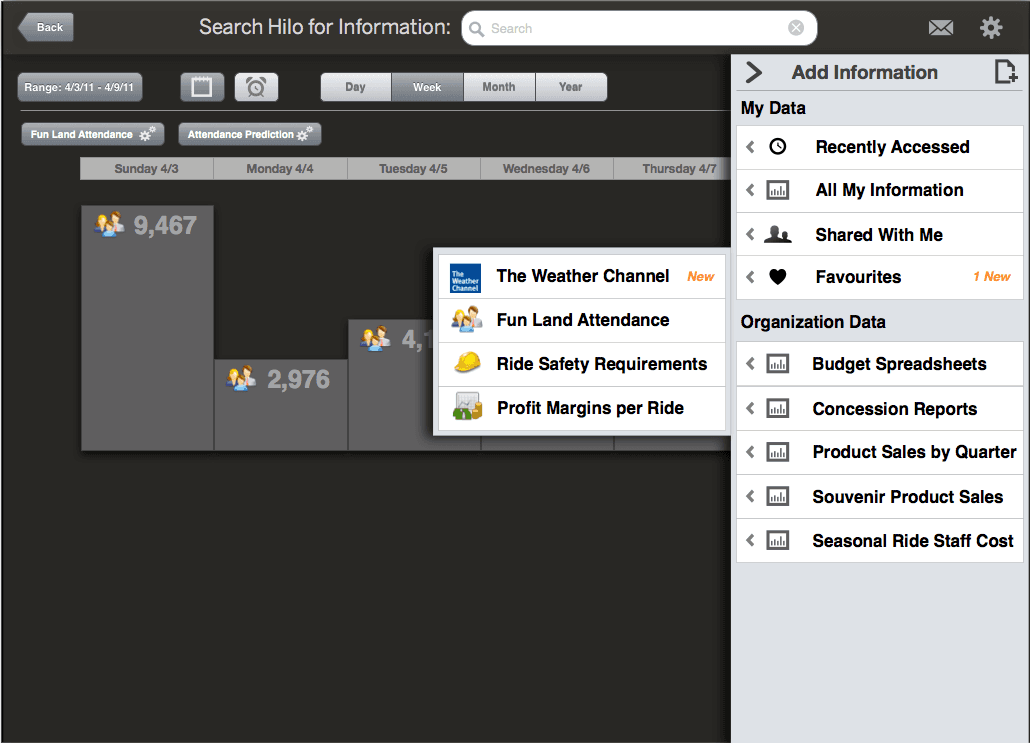
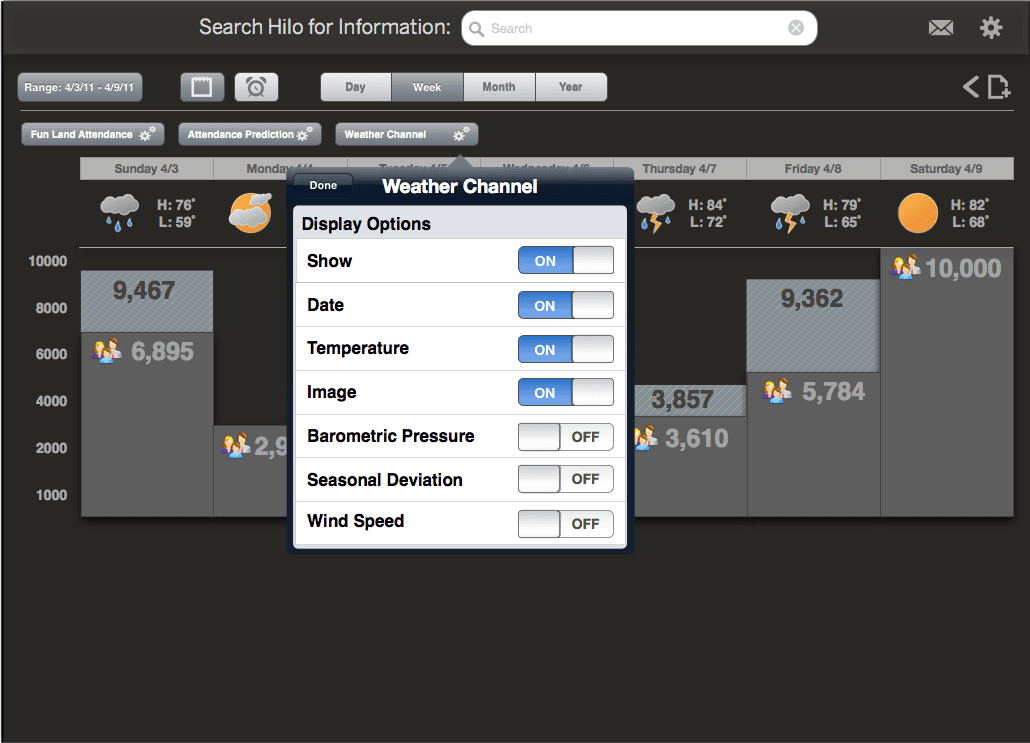
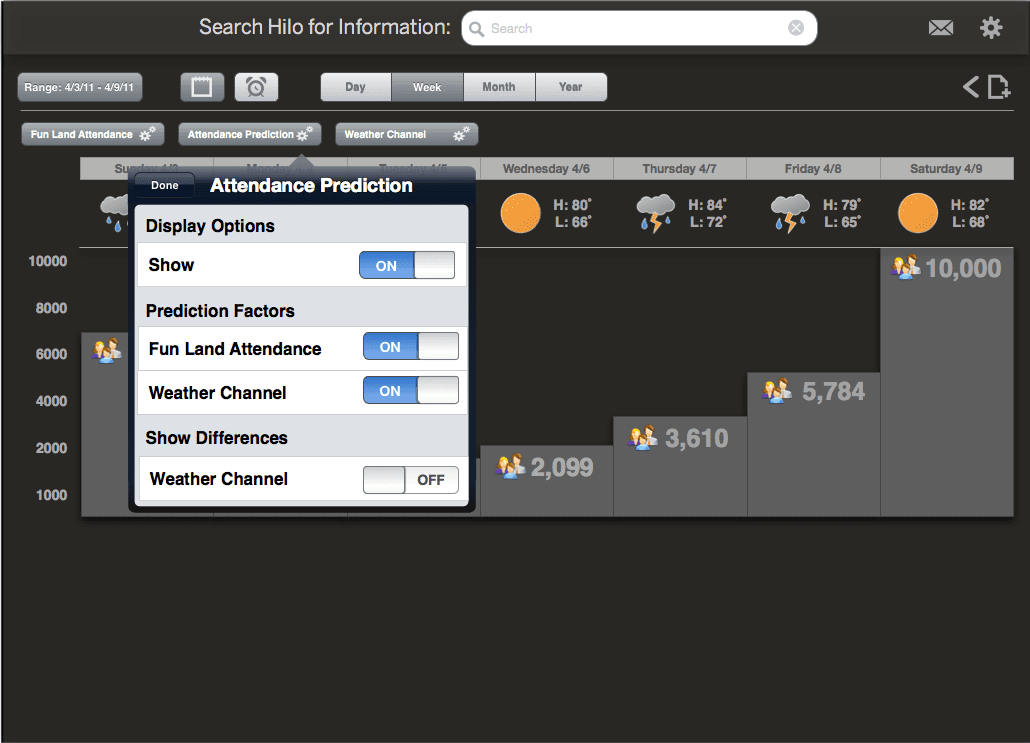
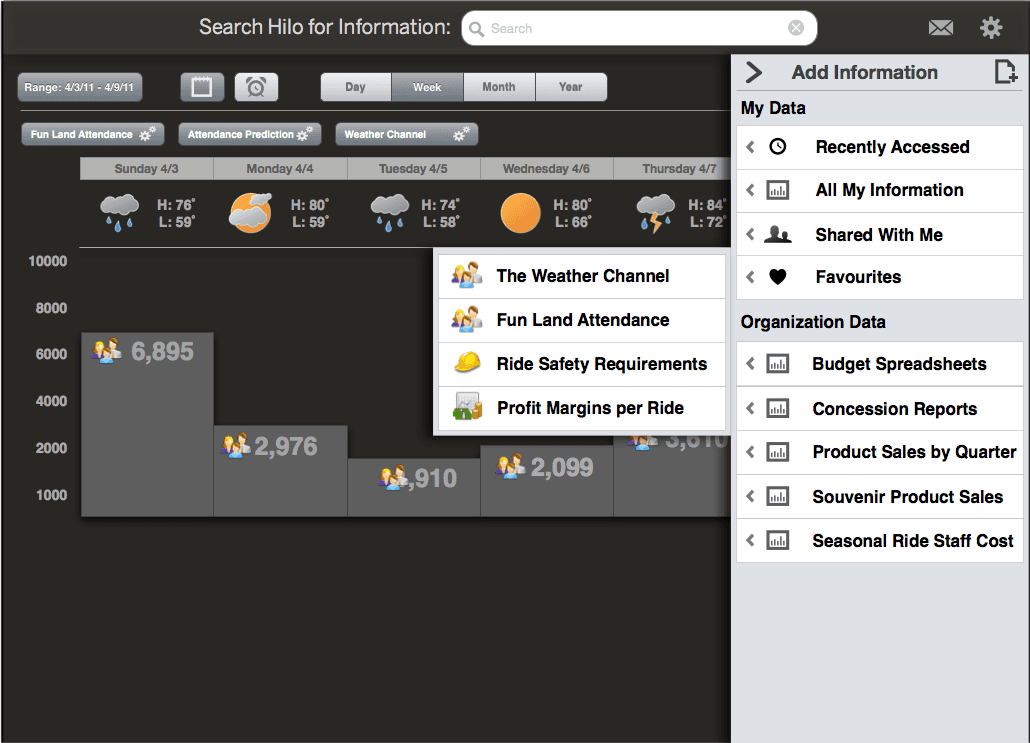
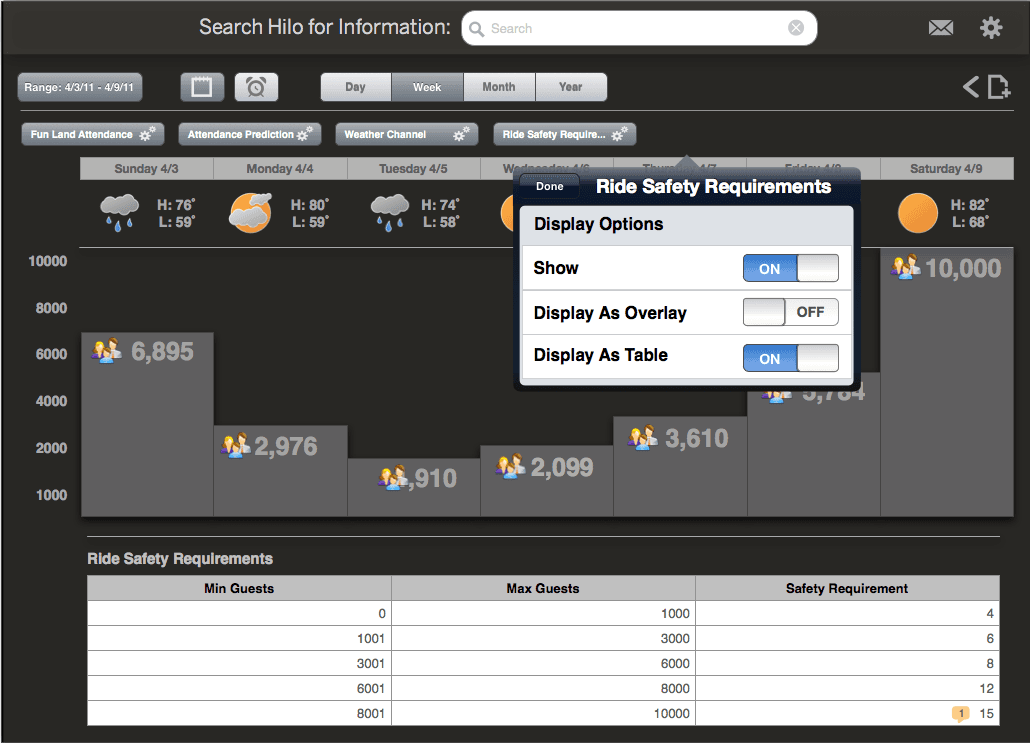
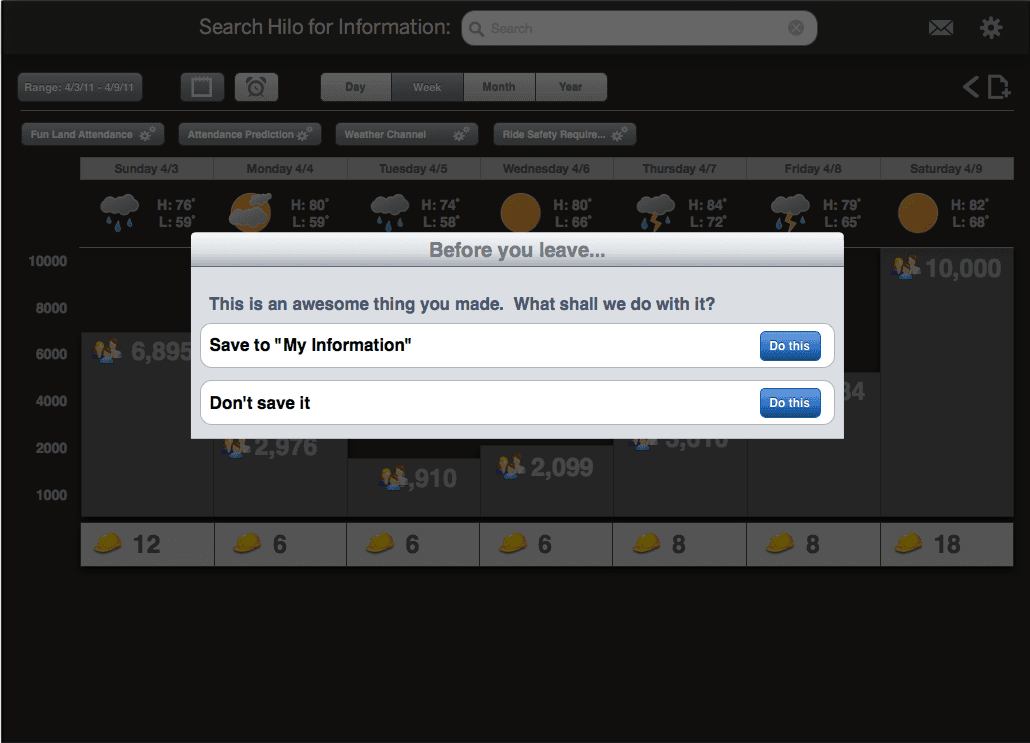
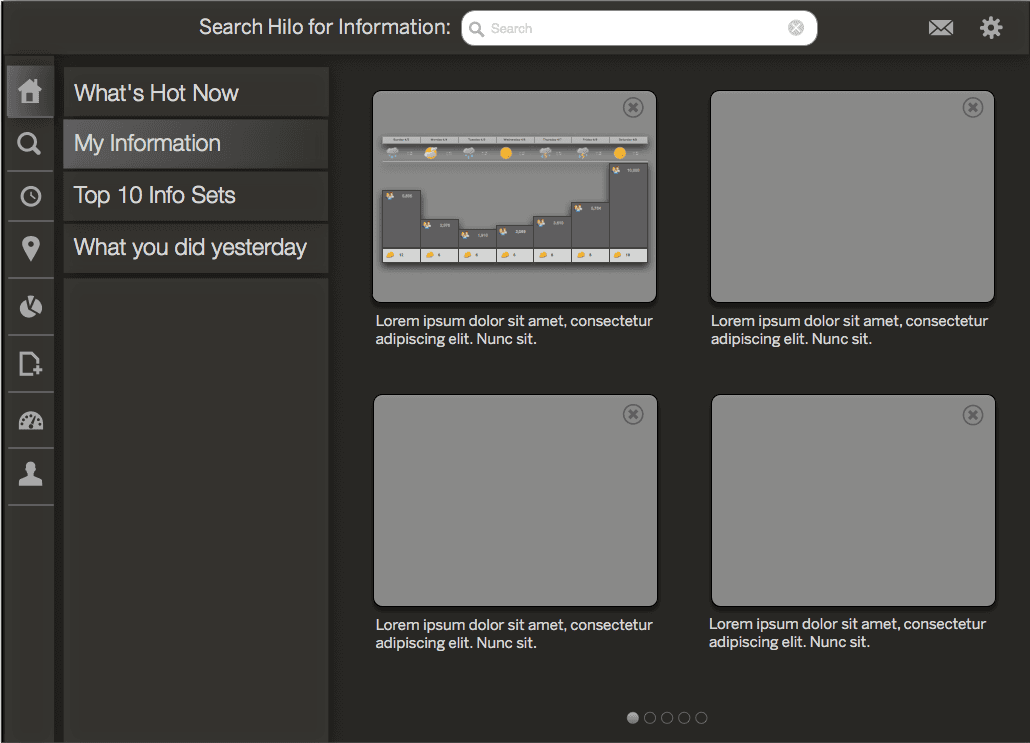
theme park prototype

The UX team took many of the ideas generated during the user story workshop and began thinking through how these ideas could be assembled into the BI software of the future. While we didn’t ever ship these ideas, the exercise was important in getting the distributed UX team to gel together and working with Product and Engineering to present the concepts to executive leadership.

  • Simple interactions
    We used a mobile-first approach so we would not be tempted to all waaaaay more features and interactions than absolutely necessary. Also, iPads were really cool and sexy at the time.

  • Color draws the eye towards important interactions
    Big icons and simple concepts helped get our concept message across. This is what BI COULD be.

  • Use common layouts
    We used simple and familiar scaffolding to build up a data scenario. We purposefully showed the prototype in a progressive manner as it was a very compelling way to tell the story.

  • Make it easy to find data
    Finding data is always a pain, no matter how experienced the analyst. We used common consumer labels and selection interactions to help get the idea across that finding data needed to be very easy.

  • Designers having fun with color and icons
    We were NEVER going to build this, so I was more permissive with how the visual designers wanted to include colour and iconography in the concept prototype.

  • Easy to read elements. In this case data cards.

  • Search results

  • Collaborative metadata - working together is key.

  • A join by any other name is still a join
    This is a BI application after all. Blending data is a key use case for knowledge workers. Laying in a second data source. This is effectively a join, without saying so. We explored similar ideas at Sigma as well.

  • Exploring predictive analytics
    This was 2010 - we were thinking about how the system could be taught to "see" the future on behalf of the user.

  • Clean charts. Big numbers.
    BI applications are surprisingly consistent in making visualizations small, cluttered and hard to interact with. The iPad display made it easy to represent this need and to make sure that the data is king.

  • Joining in public data sources via API. Sigma is working on this in 2023/24.

  • Changing up column properties. Sure doesn't look like that tho. :)

  • Change up the prediction parameters.

  • Seeing all the data properly joined and displayed to tell the story.

  • Adding in more data elements to the visualization.

  • More tuning

  • Simple tables? Yep, they are very effective,

  • Collaboration. Comments. Working as a team is key.

  • We called this the "information overlay". Its a join under the hood. We did not explore how to perform different kinds of joins as it would have rat-holed us too deep into technical solutions.

  • Sometimes you want to save. Sometimes you don't. Why clutter your life?

  • Simple landing page of dashboards

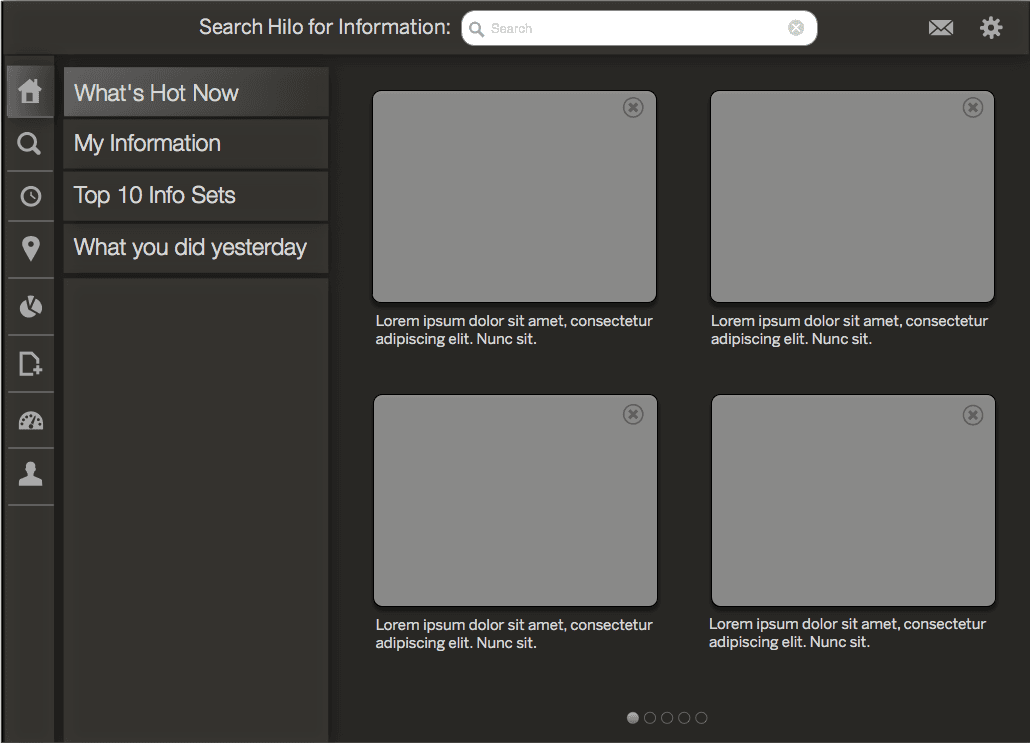
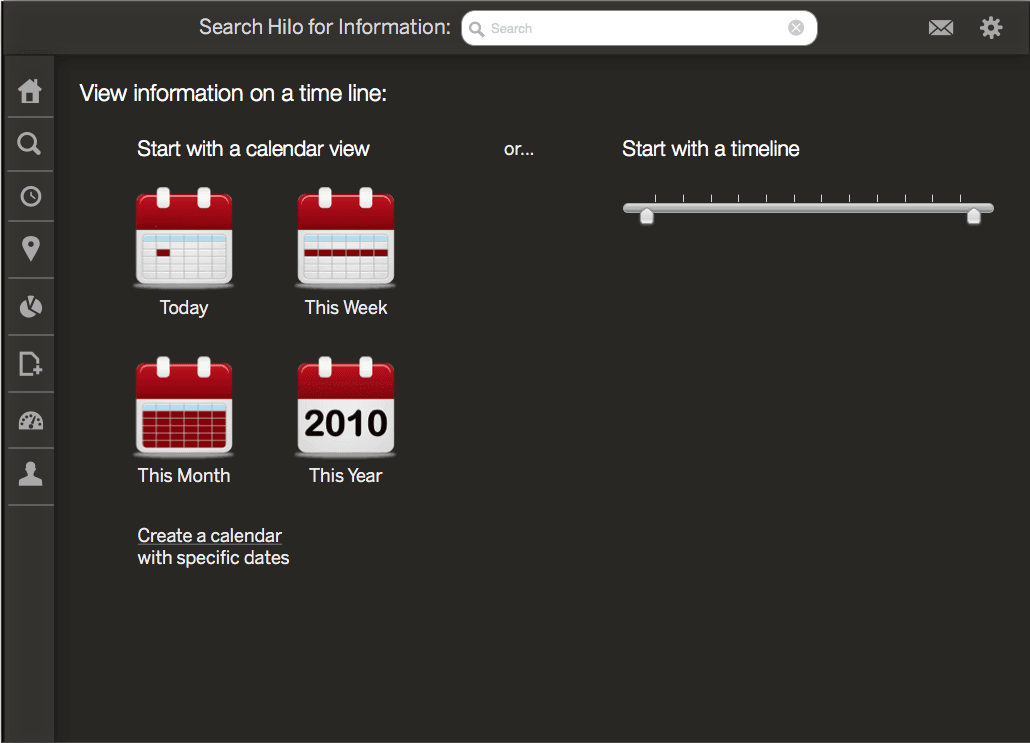
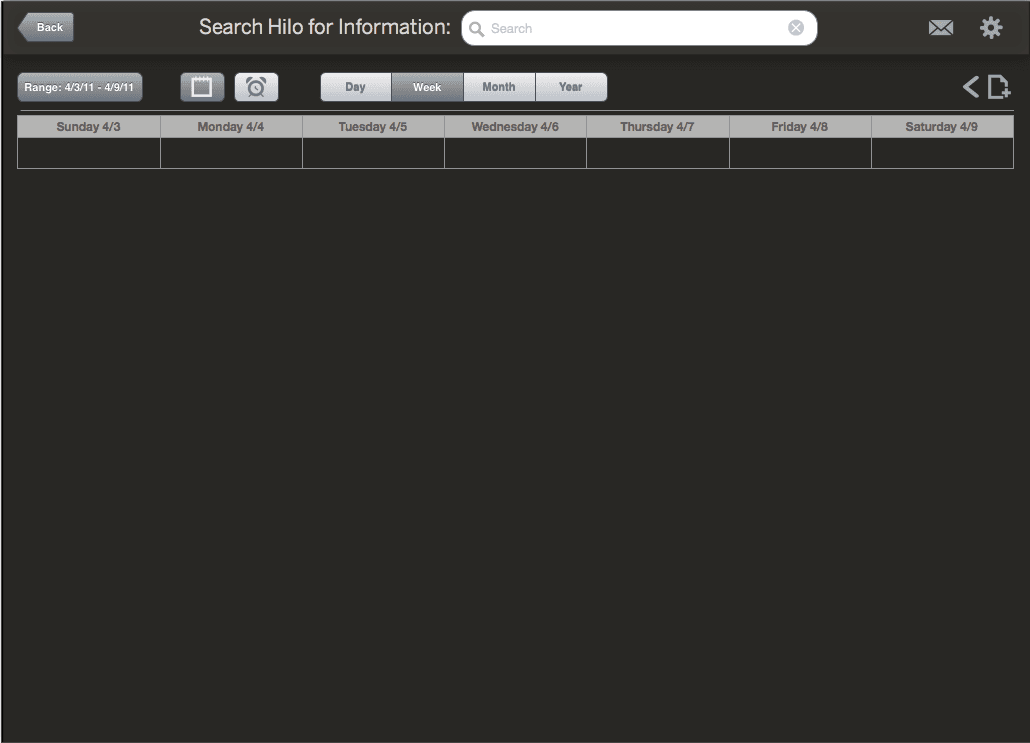
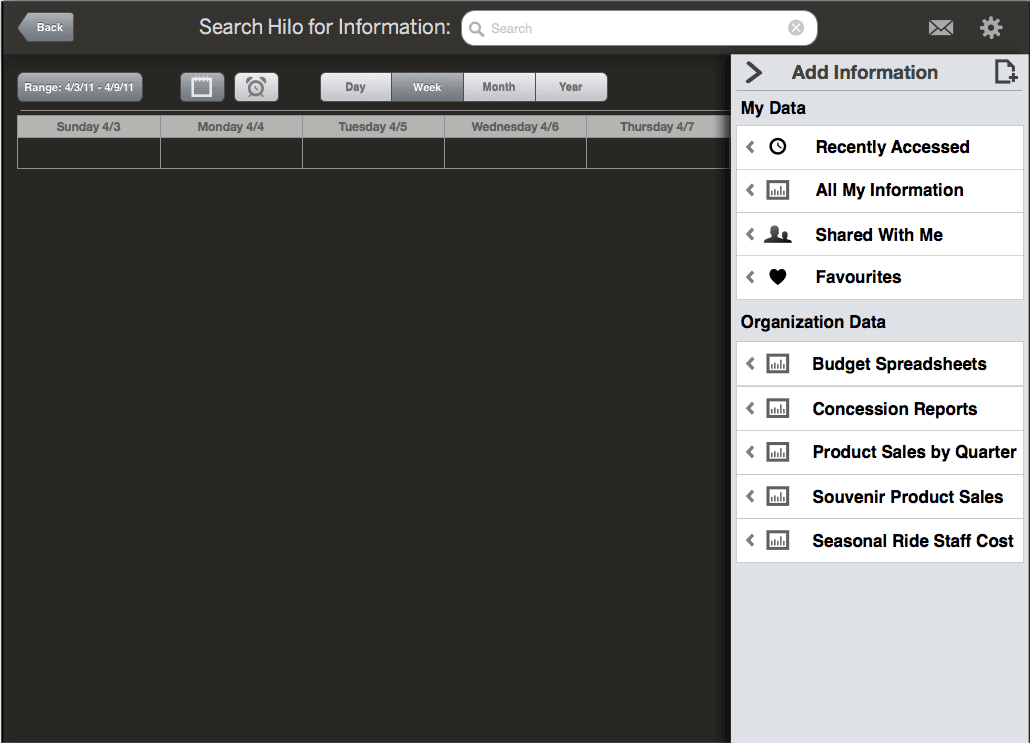
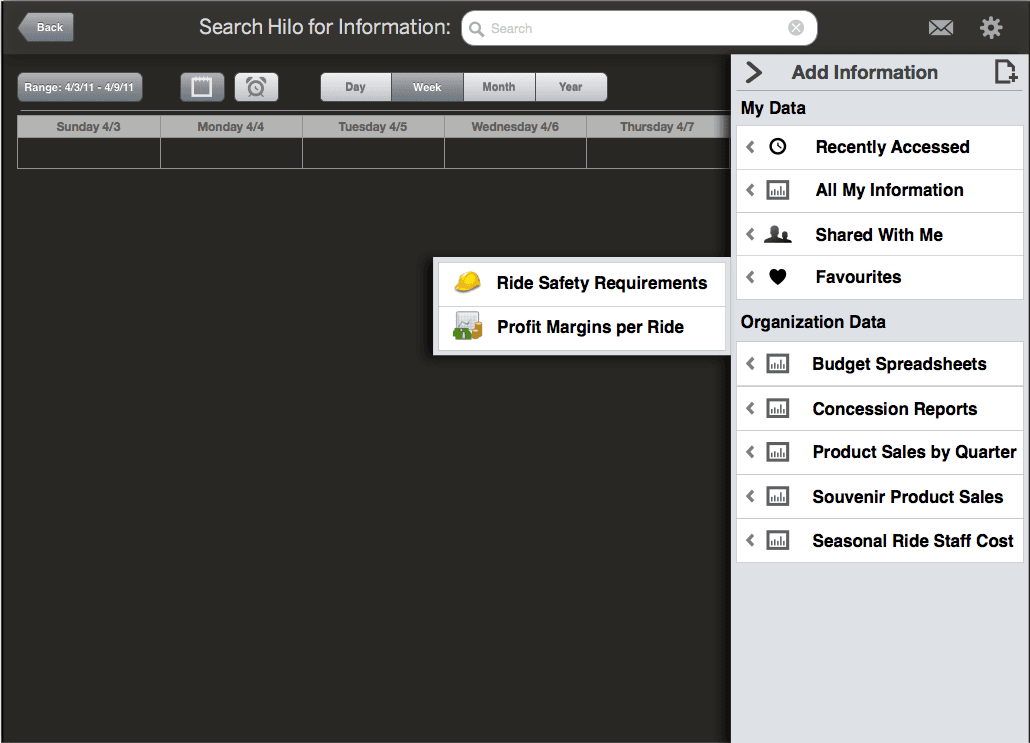
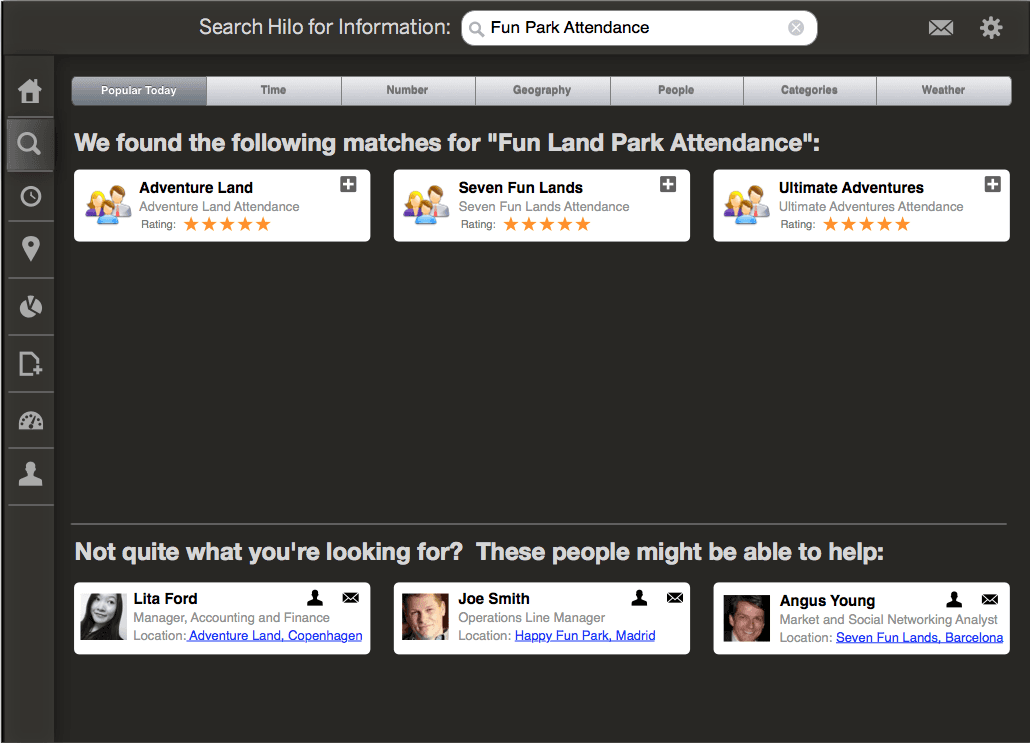
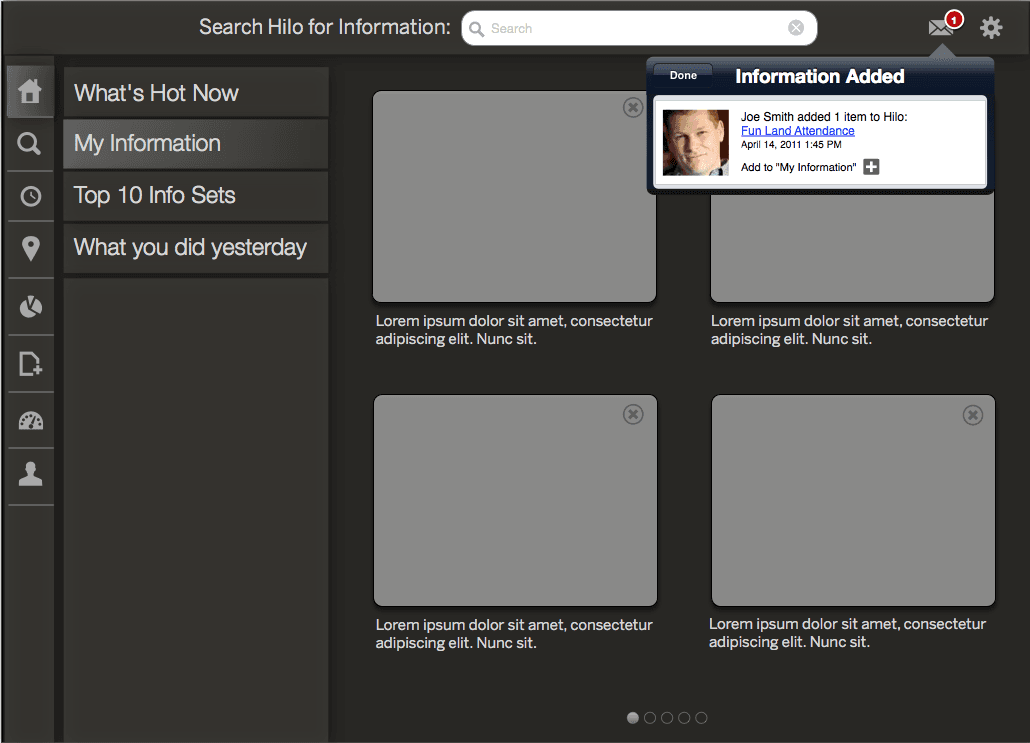
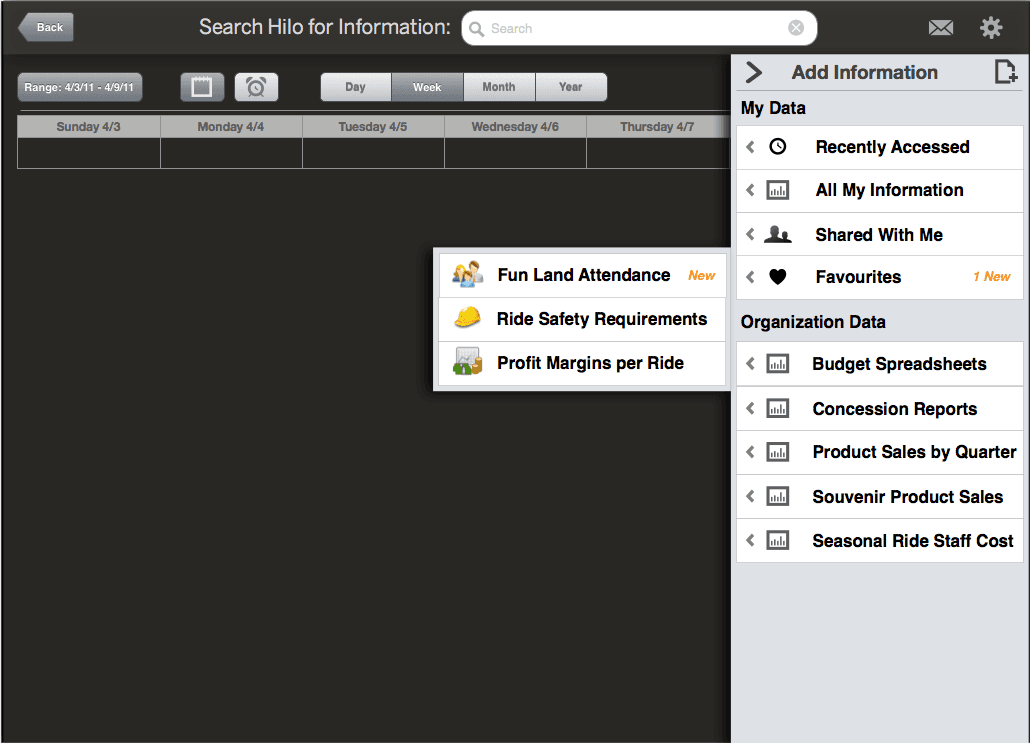
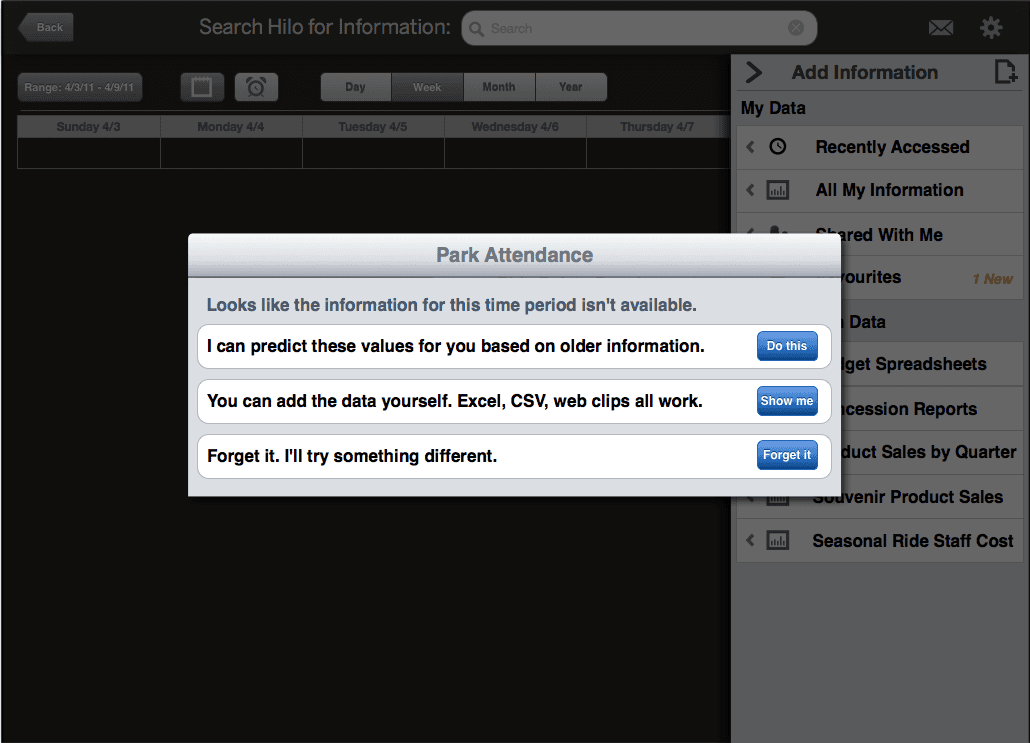
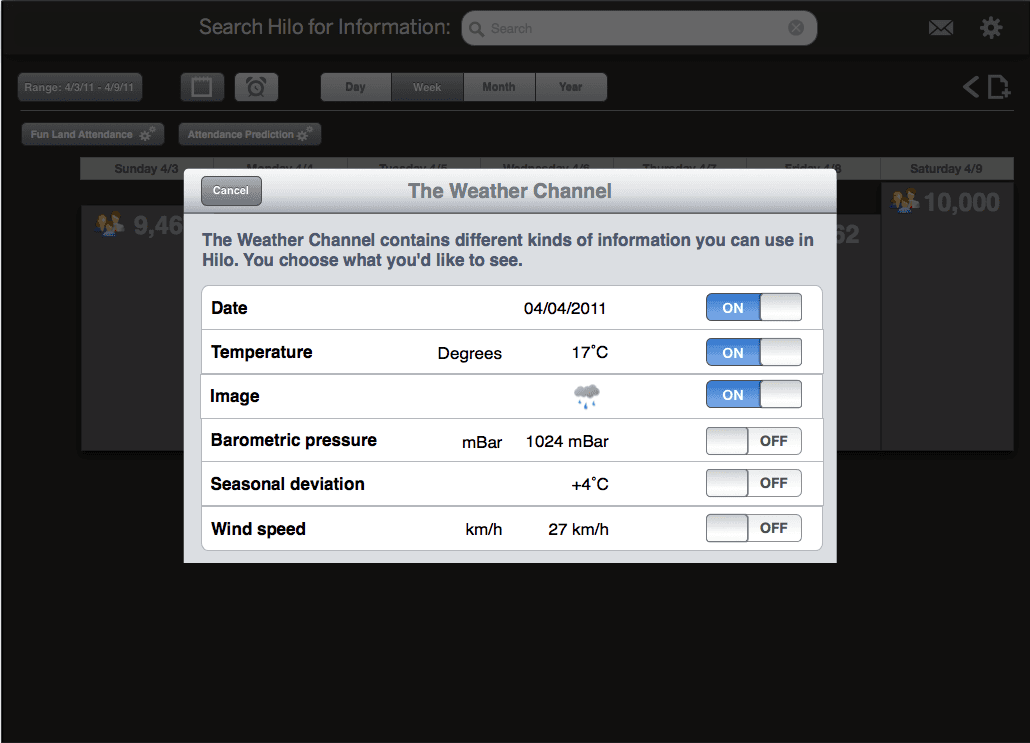
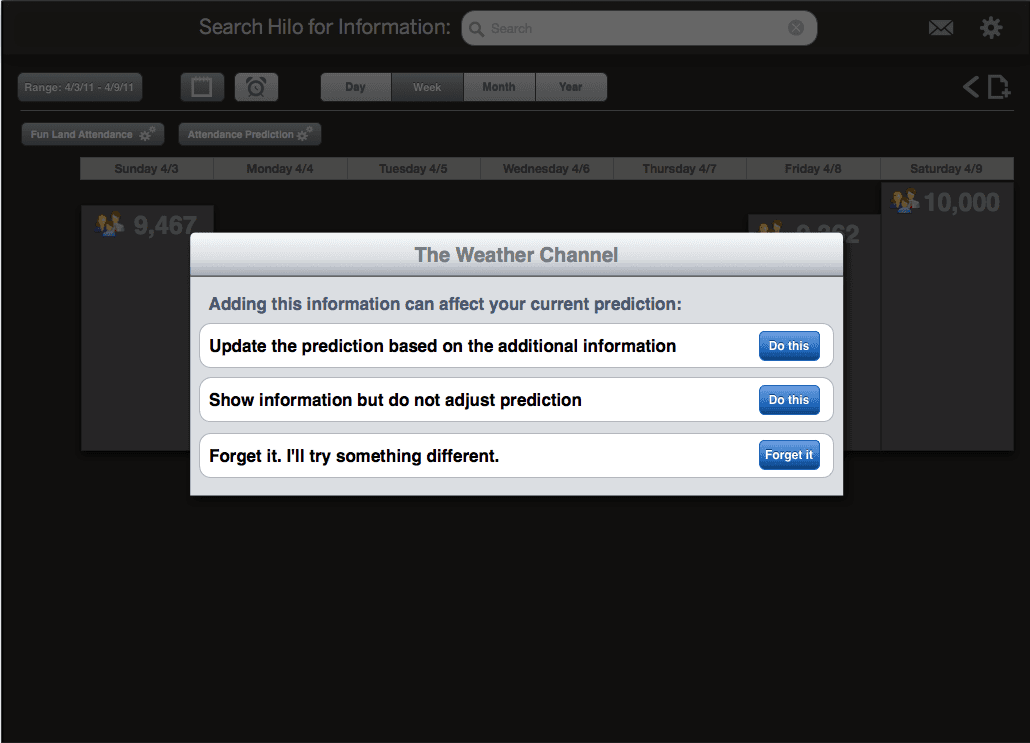
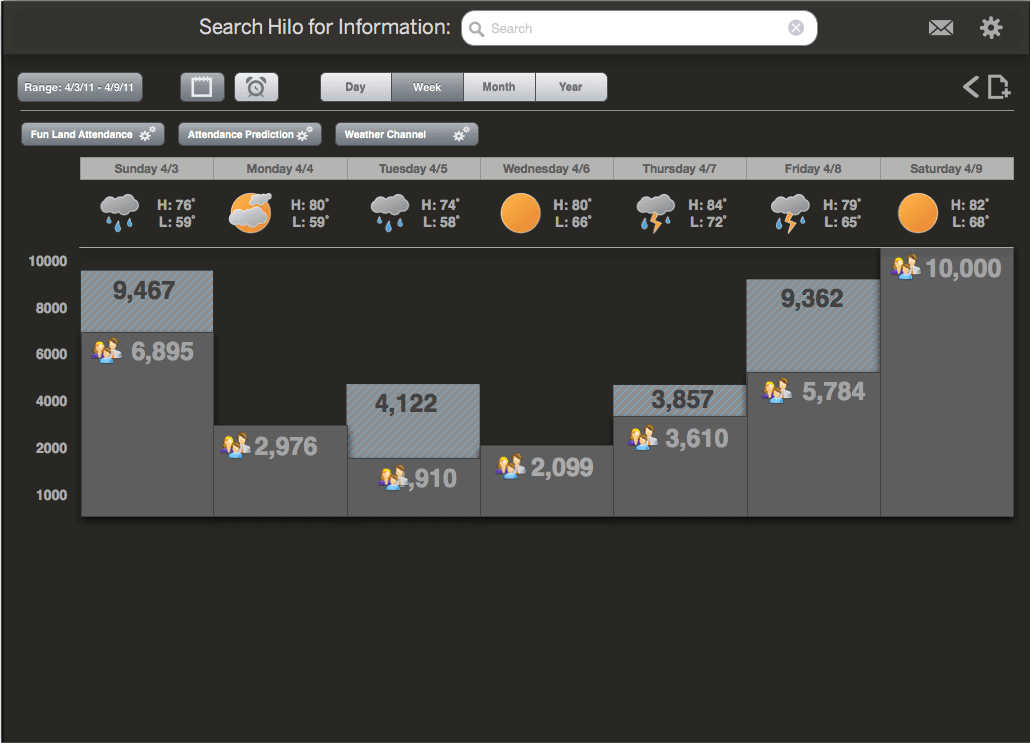
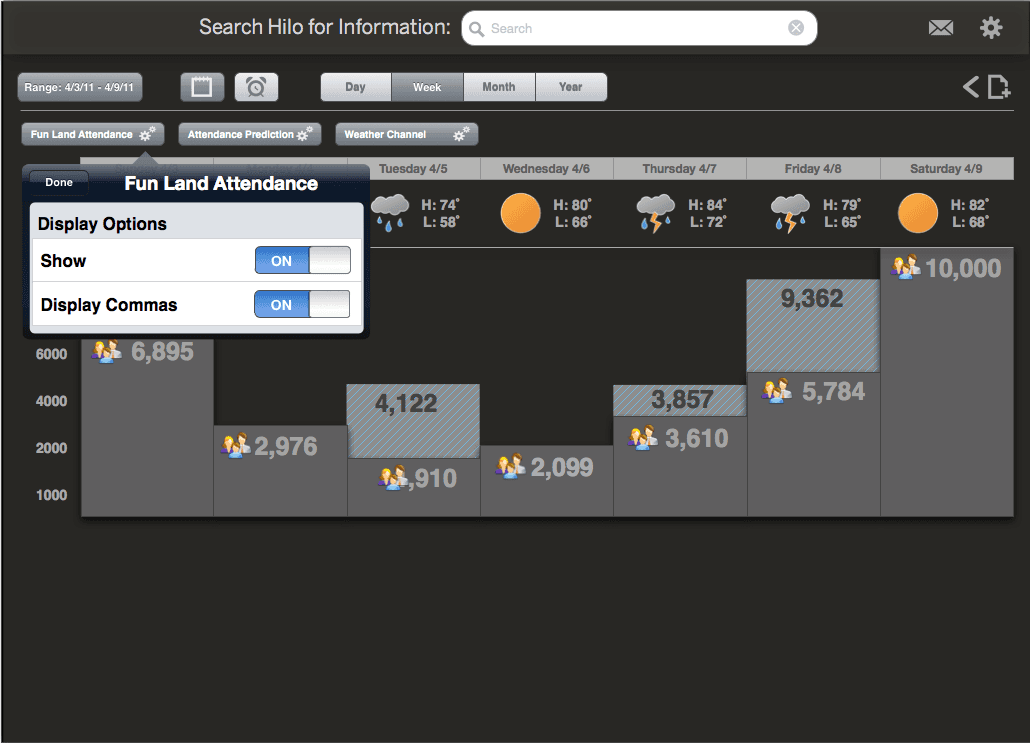
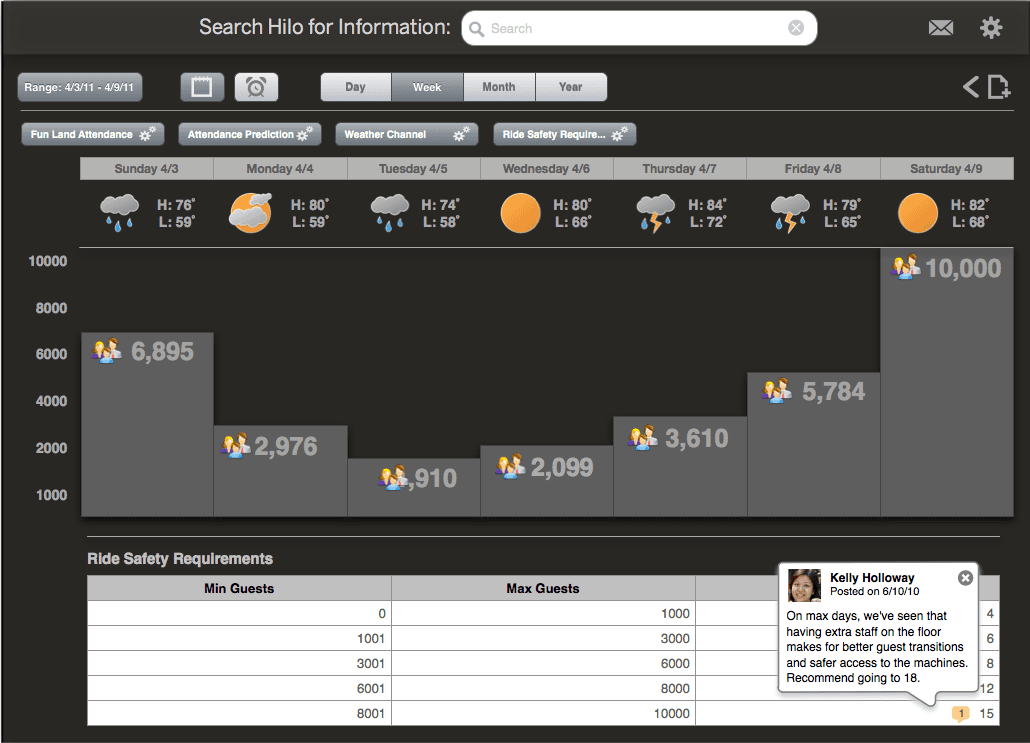
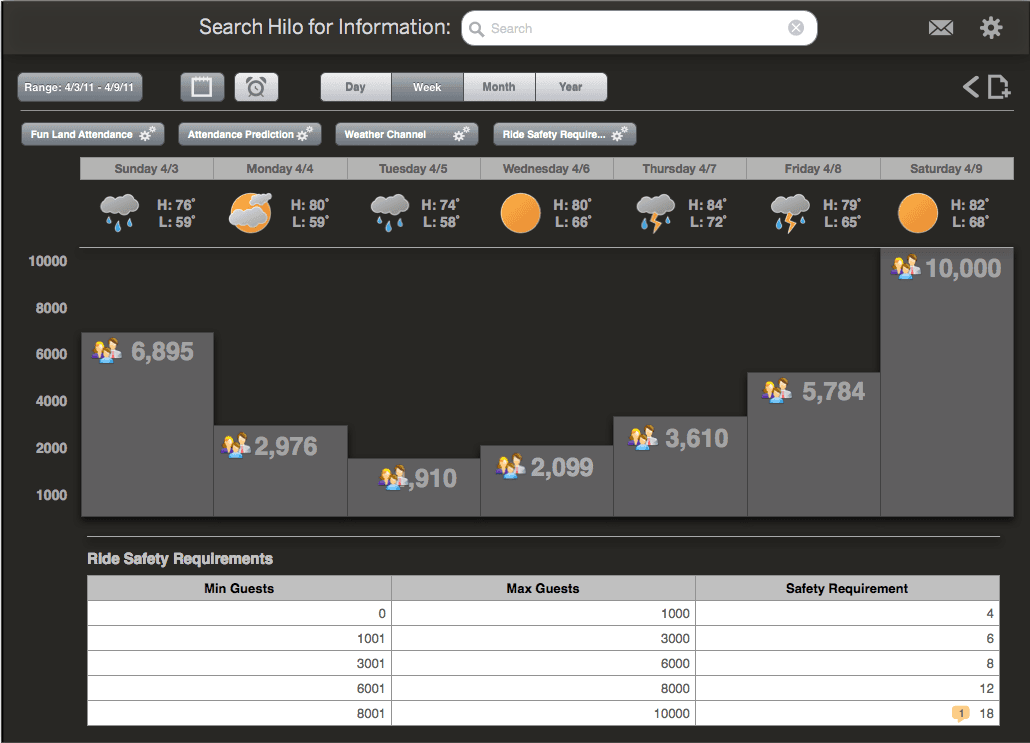
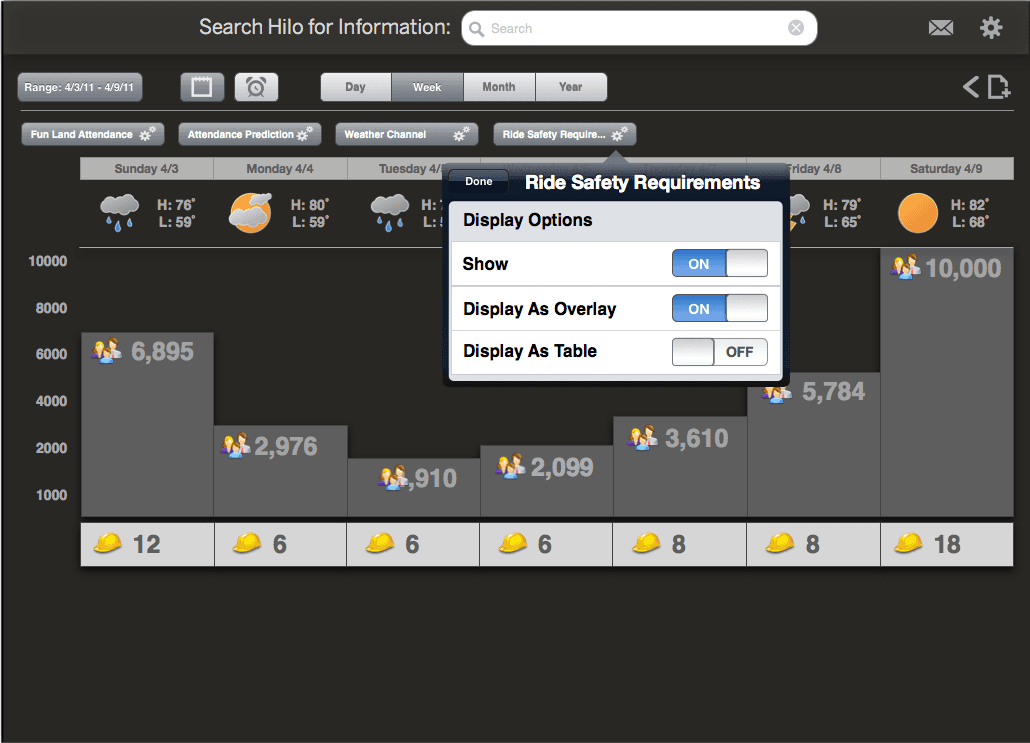
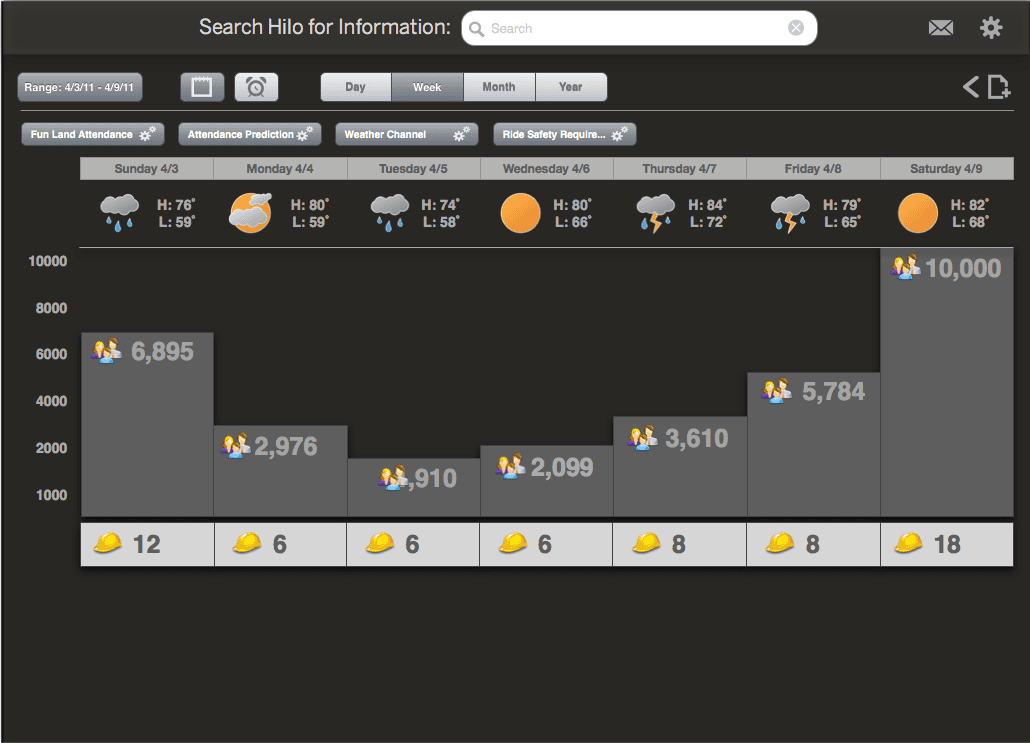
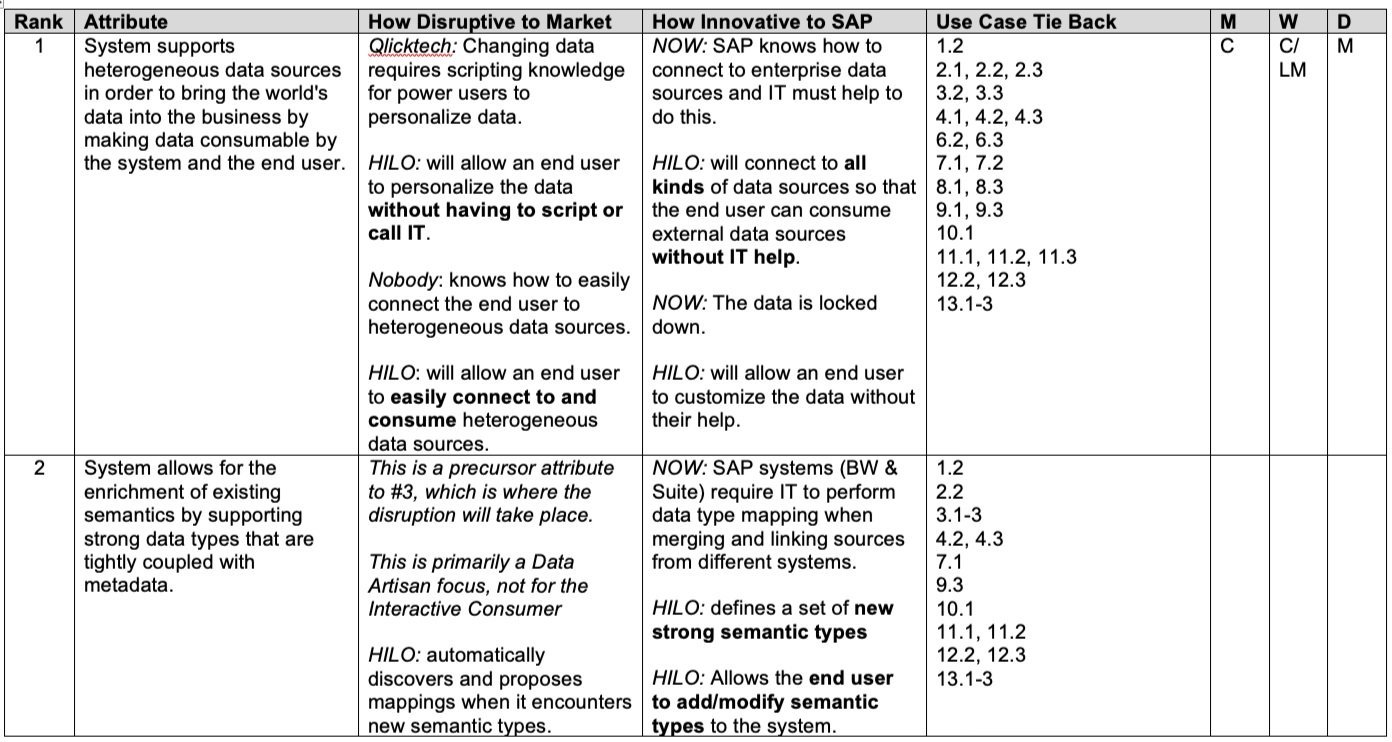
Realistic use cases emerge

While some of the user stories generated were a little bit of science fiction, some realistic use cases did come out of the exercise and started to take shape. These were indeed realistic and could be designed and developed. The code name for the project was Hilo. I had just come back from a vacation to the Big Island… :)

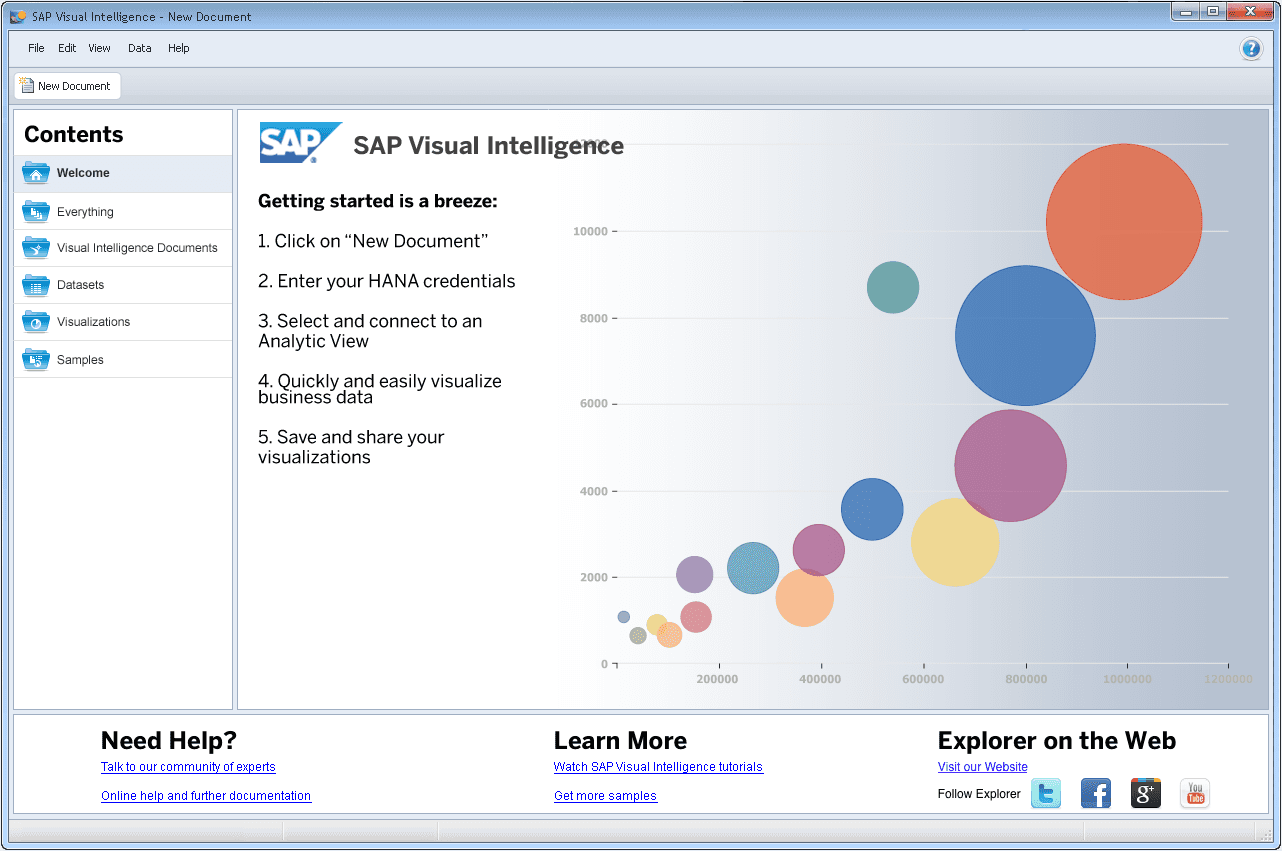
18 months later, lumira
  • There was inter-site conflict

  • There were staffing concerns

  • There were budgetary issues

  • There were 3 or 4 corporate re-orgs affecting the whole team several times over

  • There were technology changes

  • There were architectural changes

  • There were product naming battles

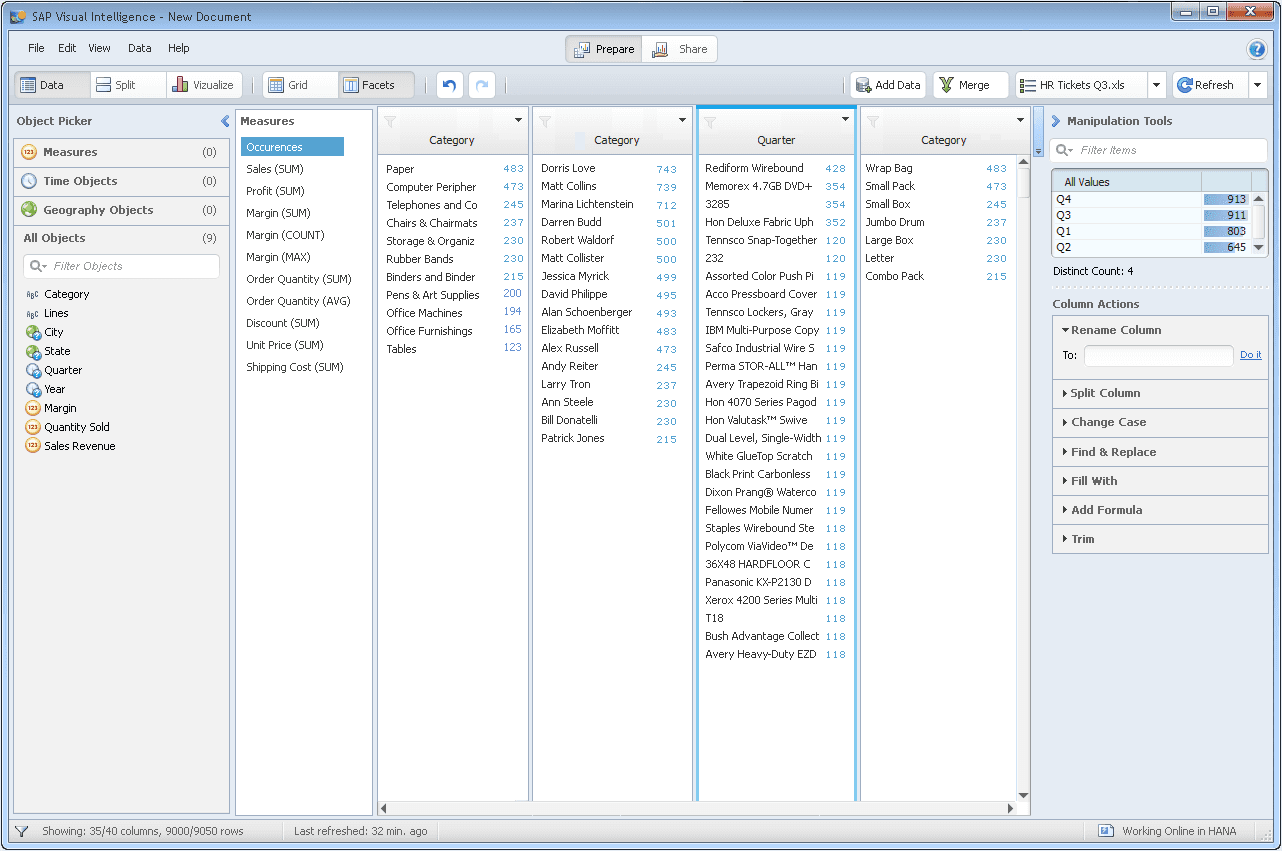
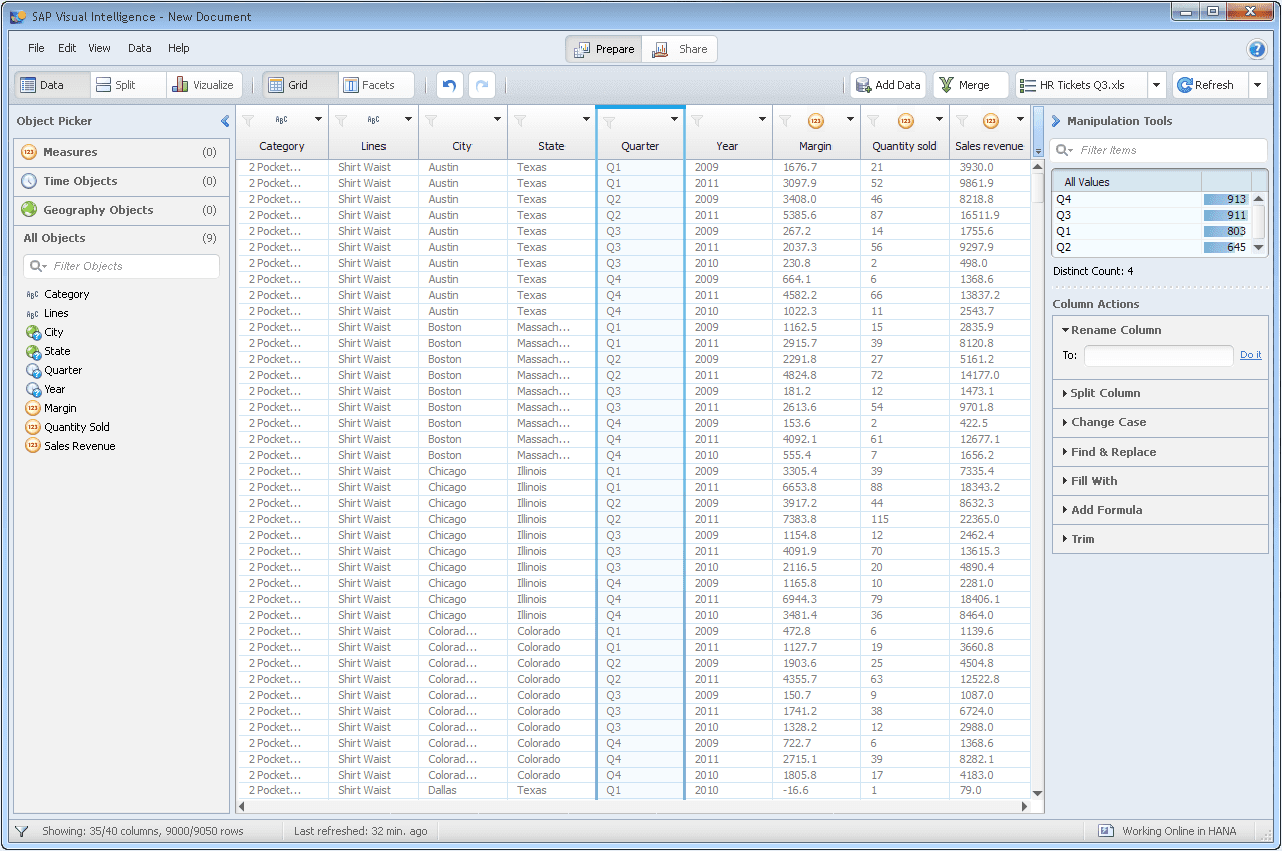
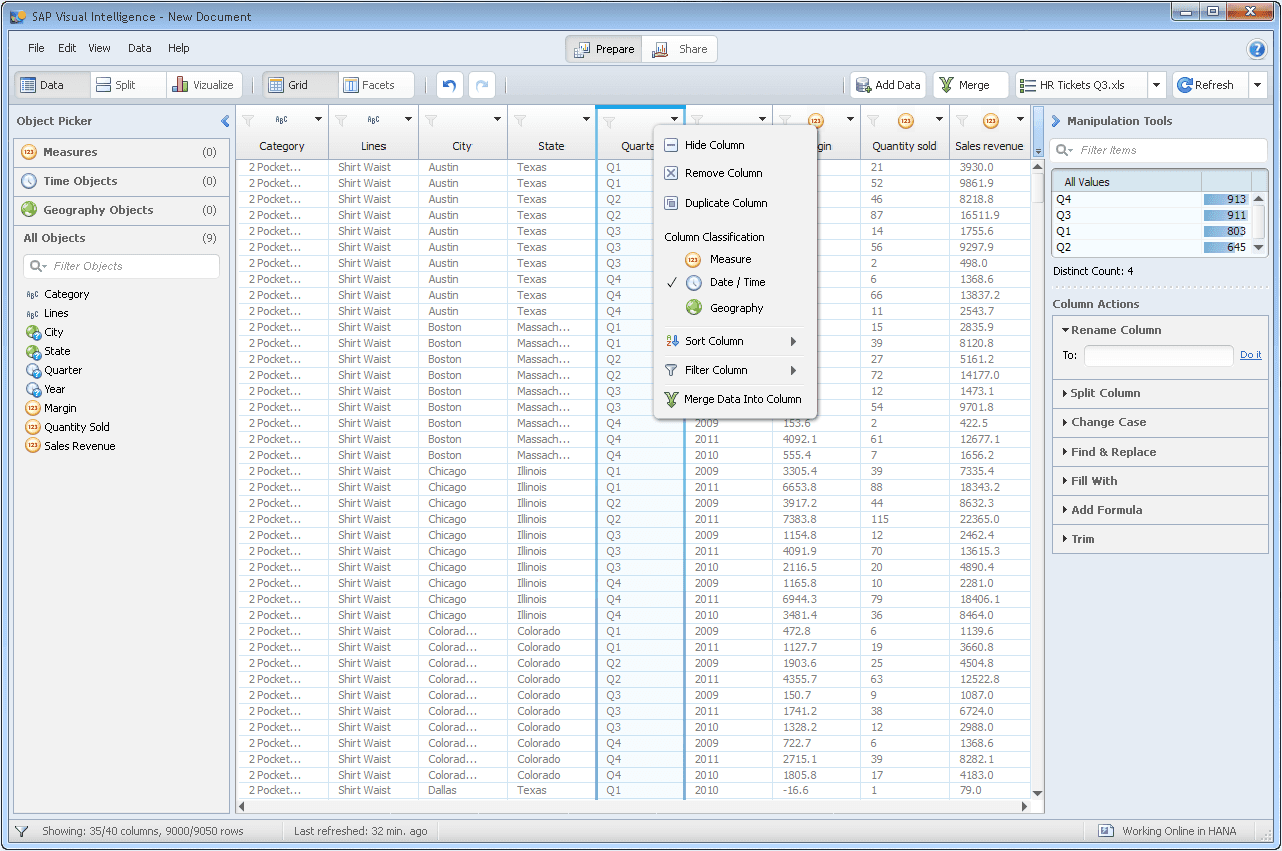
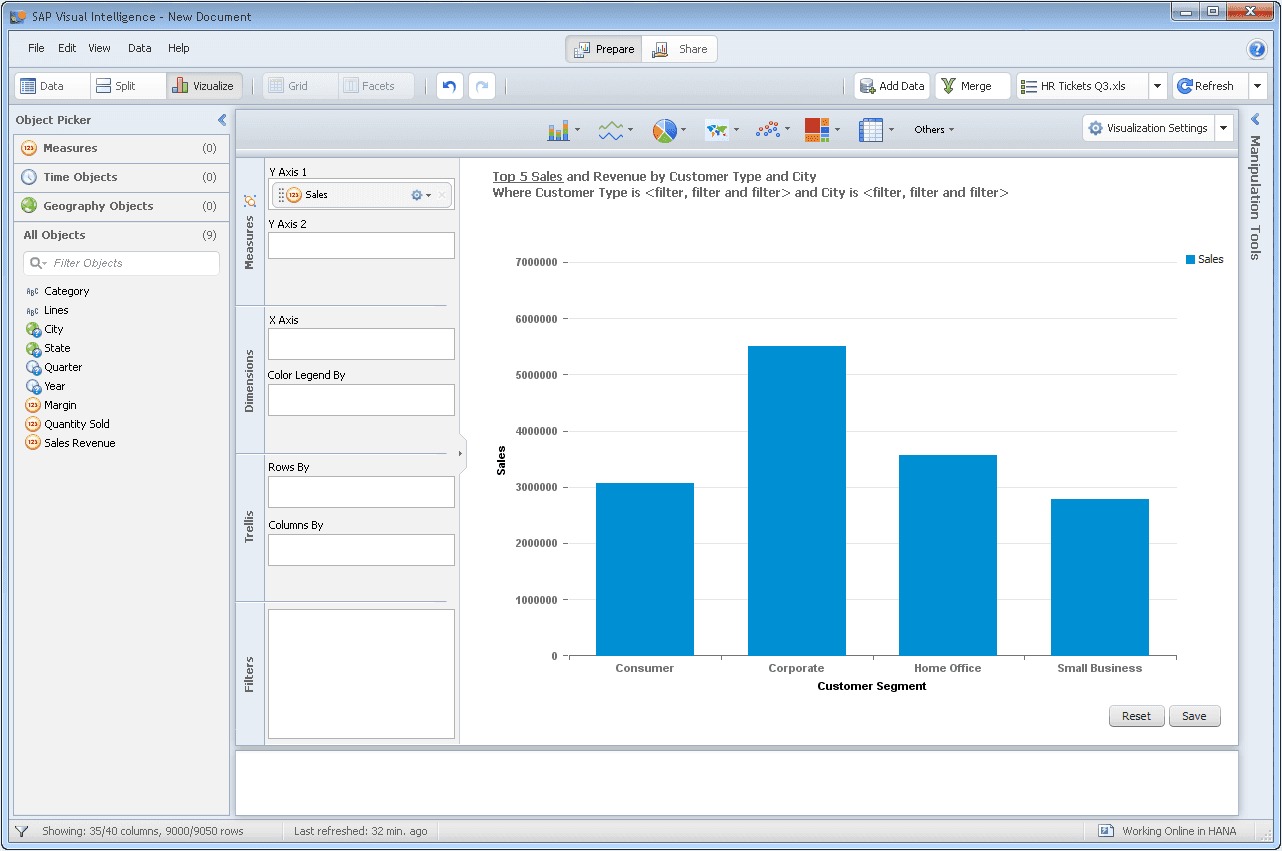
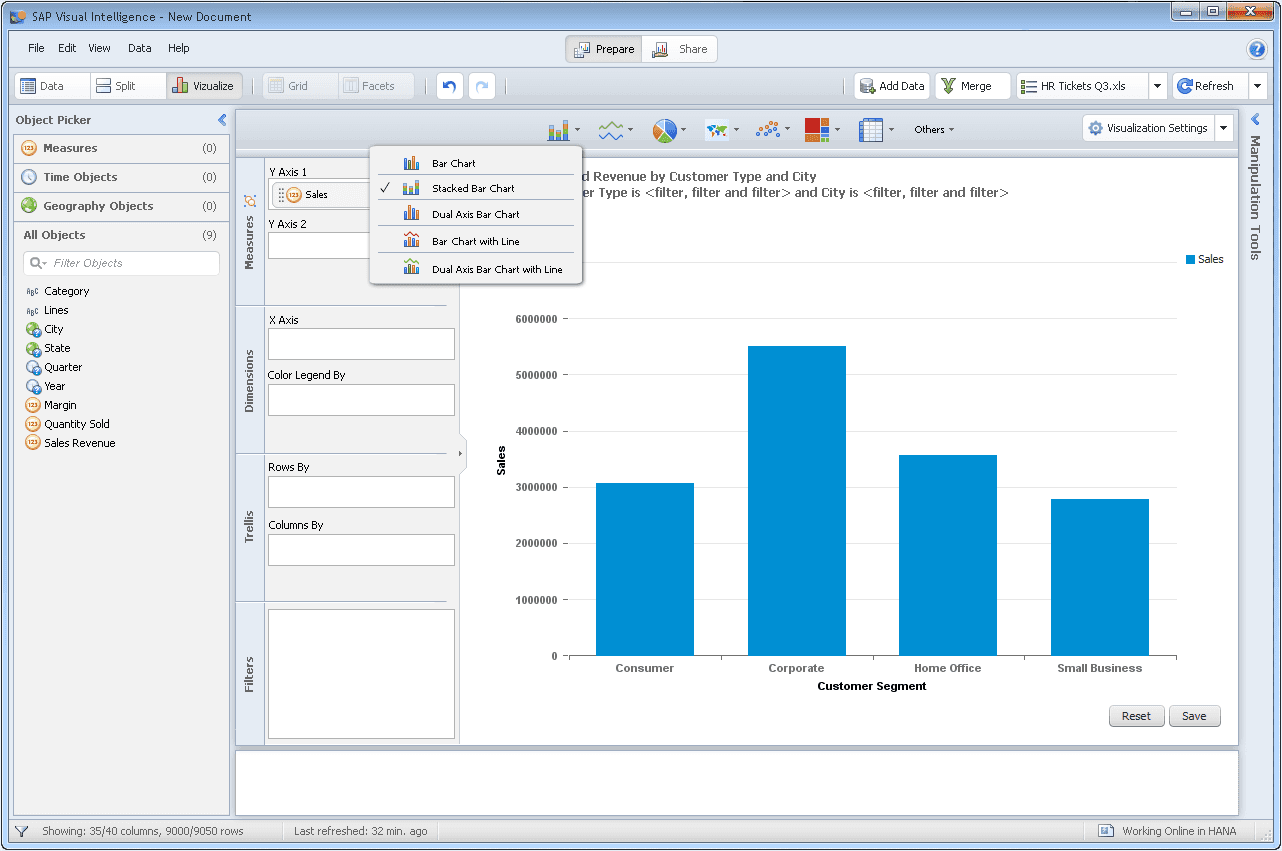
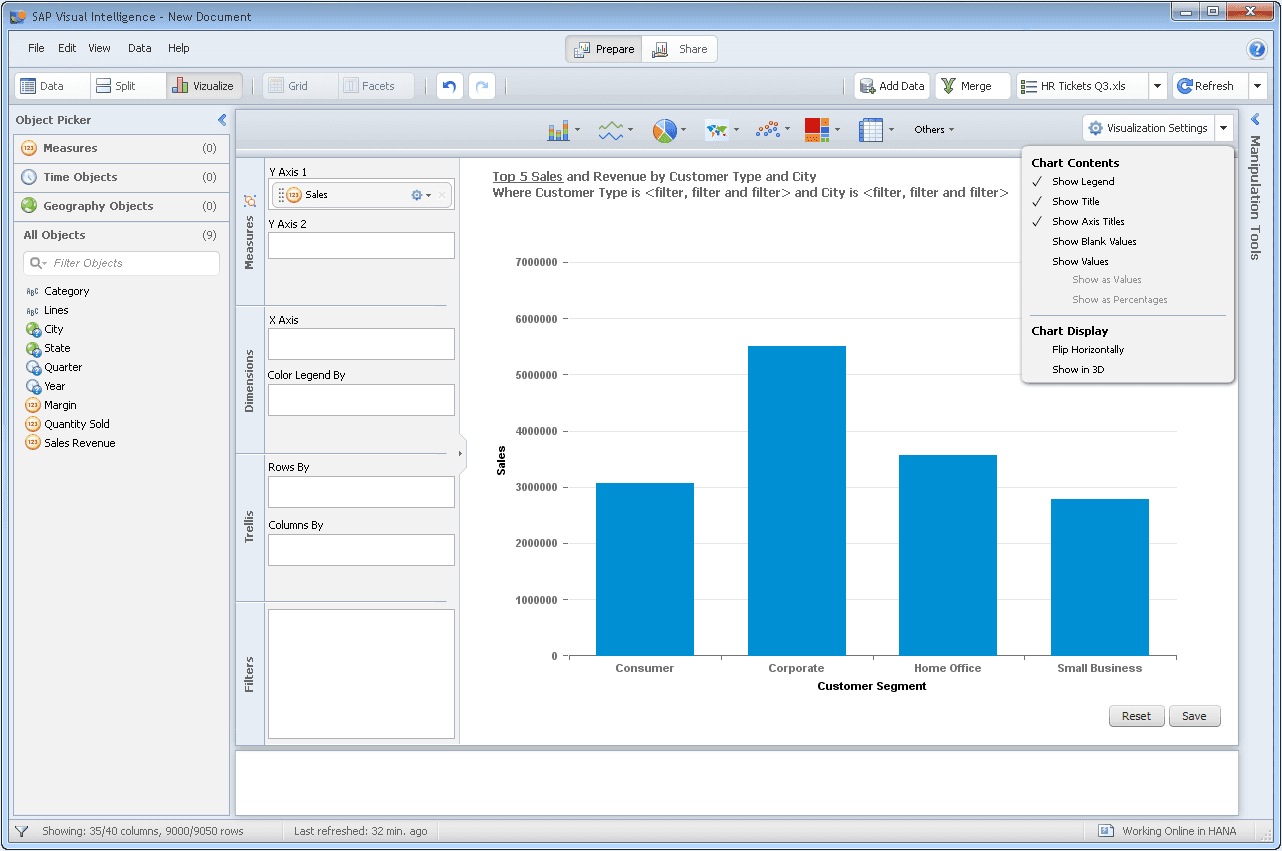
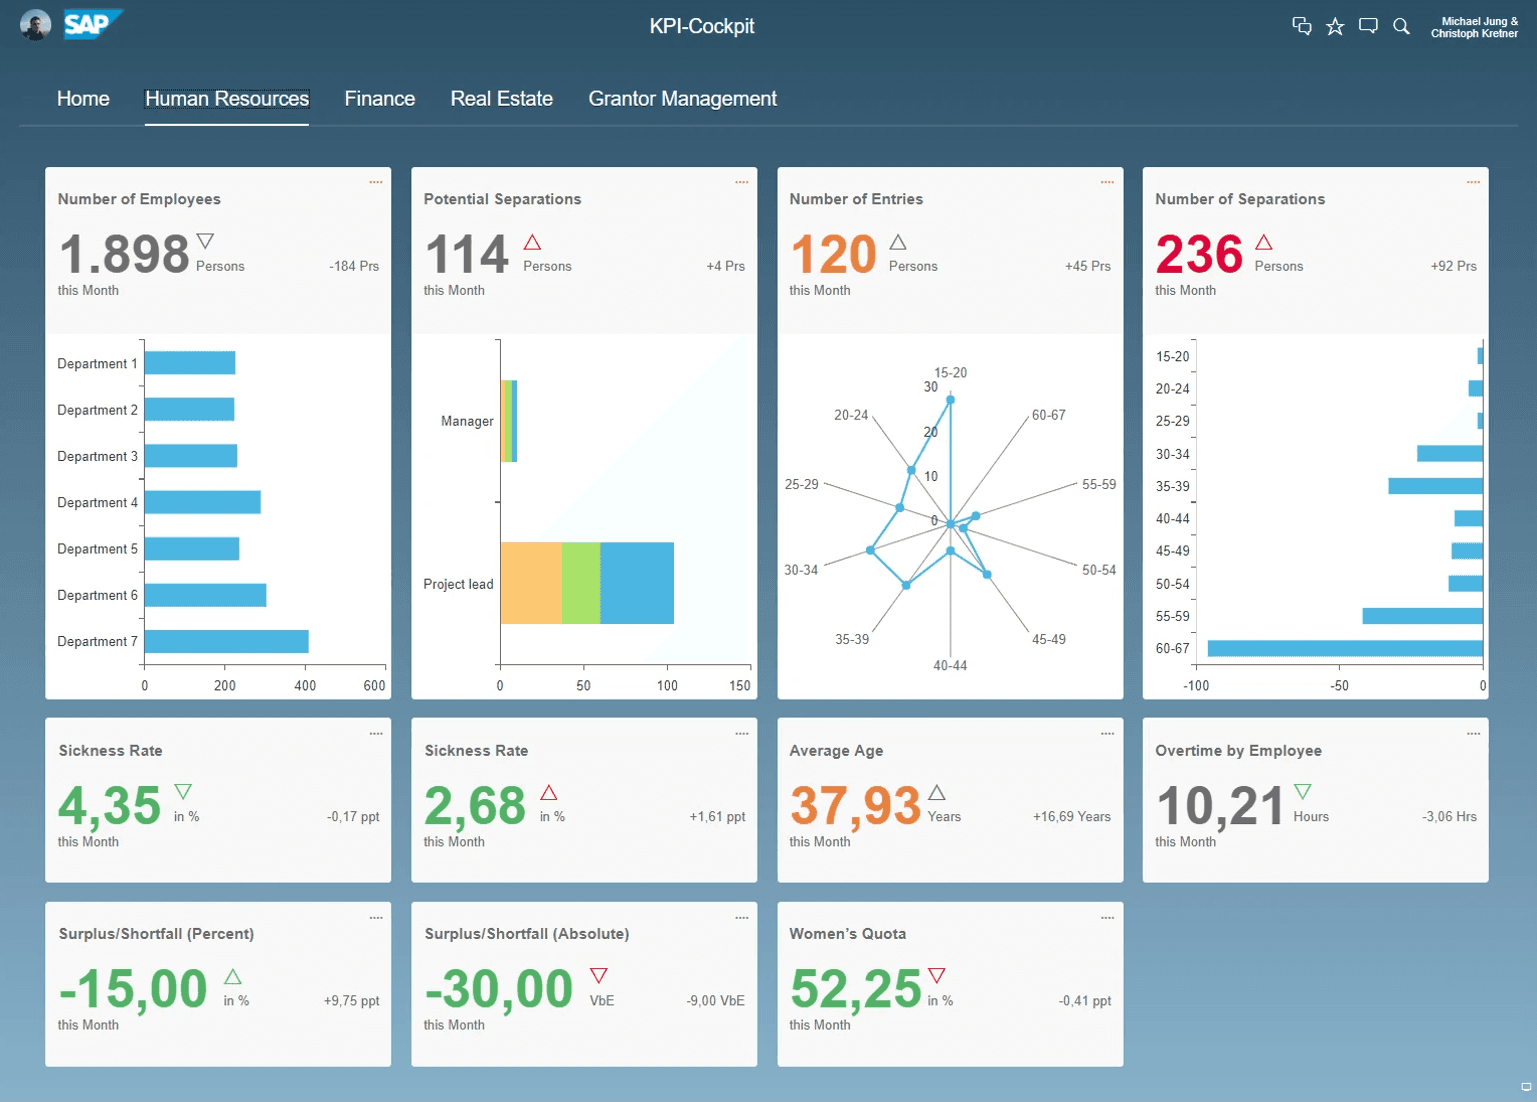
Through it all, we persevered and shipped Lumira in its Windows-only version. Eventually, the product was re-written in HTML/JavaScript for a more polished, modern experience.

  • Landing page
    Stylized bubble chart. I argued to allow this page to be permanently dismissed on demand. I hope this eventually happens.

  • Using color well to indicate column selections.

  • Changing the granularity of columnar data.

  • Column actions
    This is usually a place where menus get crammed with actions. We opted to keep these to the absolute minimum so the use could focus on the most common tasks.

  • Displaying the column as a bar chart

  • Chart types (appropriate to the data)

  • Viz settings